Download
1 / 14
140 likes | 225 Vues
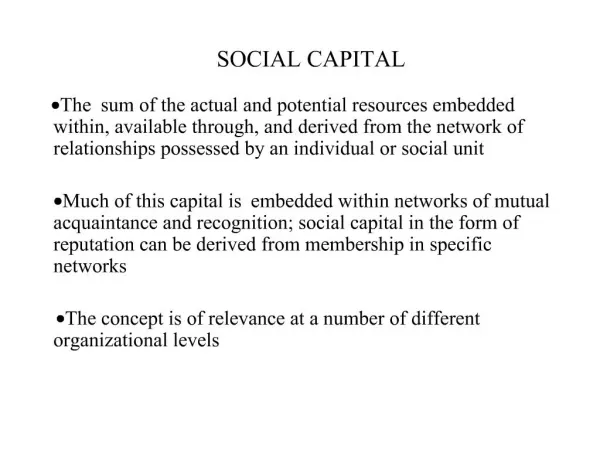
Youth Profile Social Capital in GLLEN Region. Anne Brinsden Assistant Regional Director, Early Childhood and Youth, Loddon Mallee Region 21 st June 2012. What do we know about how we learn?. Social gradient of learning

E N D
Youth Profile Social Capital in GLLEN Region Anne Brinsden Assistant Regional Director, Early Childhood and Youth, Loddon Mallee Region 21st June 2012
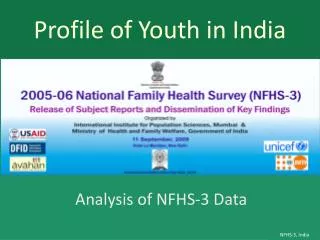
What do we know about how we learn? Social gradient of learning • Effects on literacy and numeracy achievement at school entry to mid school years: • Educational attainment of the mother • Quality of learning in the home • Quality of early childhood education Social Gradient of Health • The best predictor of poor health and even death in middle age may be failure to learn to read by the age of 8 years (Associate Professor Jill Sewell)
LMR Demographics CGB =19.4 Loddon = 23.3 MRCC = 27.0 Gannawarra = 25.1 Swan Hill = 29.2 Campaspe = 19.8 LMR had a record number of CP notifications in 2011 Bendigo = 6.4% Mt Alexander = 5.3 Central goldfields = 19.6% Bendigo = 18.3%
LMR Index of Relative Socio-economic Disadvantage • Number and percentage of the population living in collector districts with SEIFA score under the 986 Regional Victorian average, 2006 (ABS 2006)
Current Impacts: Loddon Mallee Region Adolescent Profile Swan Hill = 29.2 Mildura = 27.0 Gannawarra = 25.1 Loddon = 23.3 Campaspe = 19.8 CGB = 19.4
LMR Government School Student Absences by Year Level School absences by year correlate with vulnerability cohorts
Central Goldfields Shire • SEIFA = 1 out of 79 i.e. most disadvantaged municipality in Victoria
City of Greater Bendigo • SEIFA = 33 out of 79: 1 = most disadvantaged municipality in Victoria
Mount Alexander Shire • SEIFA = 30 out of 79: 1 = most disadvantaged municipality in Victoria
The Costs of Disengagement For every dollar that government invests in retaining early school leavers, the expected return is as much as 3.2 times more