Modell’s DEA Analysis
Modell’s DEA Analysis. INPUT/OUTPUT MODEL. Store area. Backroom area. regular time. Over- time. traffic. STORE. Transactions. Footware. Sports goods. Apparel. Modell’s DEA Analysis. WHAT QUESTIONS CAN BE ASKED … AND ANSWERED?. HISTOGRAM OF EFFICIENCIES. Average = 92.70%.


Modell’s DEA Analysis
E N D
Presentation Transcript
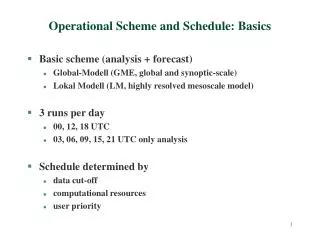
INPUT/OUTPUT MODEL Store area Backroom area regular time Over- time traffic STORE Transactions Footware Sports goods Apparel
Modell’s DEA Analysis WHAT QUESTIONS CAN BE ASKED … AND ANSWERED?
HISTOGRAM OF EFFICIENCIES Average = 92.70% 50% of stores are efficient 38% moderately inefficient (90-95% effec.) 12% are very inefficient (< 90%)
WORST-PERFORMING STORES No. Name DEA Effec. 79 WALDORF 66.48 87 GRBGRENB 73.14 71 DPTFRDMAL 74.12 24 NESHAMINY 76.81 25 CHERY_HILL 77.07 53 NEWARK 78.74 92 RKVL 80.49 26 EXTON 80.70 64 RFL_ROSE 81.58 93 MRKT 81.65
FREQUENCY IN PEER GROUP Best stores Cottman and Commack are in the peer group of many inefficient stores. This suggests these are “best practice” stores.
Footwear and sporting goods have biggest gaps in performance .
Space is not controllable in the short run. Conversion issue Store area (sales & backroom) and traffic show greatest excess. Interpretation?
Top performing Good/Fair Need improvement
HERMAN’S ACQUISITION No. DEA Eff. Name Region 71 DEPTFORD MAL PHIL 74.12 72 SECAUCAS NJ 85.19 73 UNION PLAZA NJ 86.15 74 WILLOWBROOK NJ 92.92 75 DOUGLASTON NYC 100.00 76 LEHIGH VALLEY PHIL 90.50 78 BETHESDA WASH 100.00 79 WALDORF WASH 66.48 81 RESTON WASH 95.50 82 SPRINGFIELD WASH 86.78 83 LIVINGSTON NJ 87.29 Herman's Avg. 87.72 Overall Avg. 92.70
CANDIDATES FOR CLOSURE??
CANDIDATES FOR CLOSURE?? Candidates for Closure: < 8% Profit and > 90% Eff.
Candidates for closure No. Name Region Profit %Rev Efficiency 9 JAMAICA NYC 6.93% 92.60 32 CHELTE_AVE PHIL 4.33% 94.80 35 LAK_SUCES LI 4.68% 97.27 67 WILOW_GR PHIL -5.59% 92.53 69 RKWY NJ 7.04% 90.21 75 DOGLASTON NYC 5.40% 100.00 77 ANNAPOLIS WASH 7.26% 95.50 78 BETHESDA WASH 7.23% 100.00 91 MCI NON COMP -20.07% 100.00
CONCLUSIONS • In this case: • identifies “best stores” • raises “conversion issue’” for inefficient stores • suggests that inefficient stores use too much space • footware and sporting goods often problematic • compares stores across different locations • evaluates new acquisition • suggests candidates for closure
CONCLUSIONS • In general: • DEA provides valuable additional insights