Download
1 / 15
320 likes | 1.86k Vues
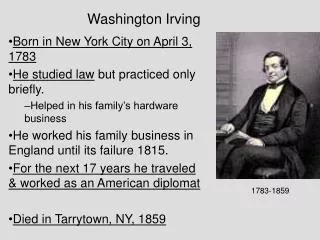
Irving Fisher. Udayan Roy http://myweb.liu.edu/~uroy/eco54 March 2008. Irving Fisher (1867-1947 ). The Rate of Interest , 1907 The Theory of Interest , 1930 The Purchasing Power of Money , 1911 Mathematical Investigations in the Theory of Value and Prices , 1925.

E N D
Irving Fisher Udayan Roy http://myweb.liu.edu/~uroy/eco54 March 2008
Irving Fisher (1867-1947) • The Rate of Interest, 1907 • The Theory of Interest, 1930 • The Purchasing Power of Money, 1911 • Mathematical Investigations in the Theory of Value and Prices, 1925 IRVING FISHER
Cardinal utility unnecessary • He was the first to show that cardinal utility was unnecessary for the theory of demand and that ordinal utility was all that was needed. • VilfredoPareto further elaborated on this idea more than a decade after Fisher. IRVING FISHER
Diagrammatic Utility Maximization • He introduced the familiar diagrammatic representation of the maximization of utility subject to a budget constraint. • Indifference curves themselves were introduced by Francis YsidroEdgeworth in his MathematicalPsychics, 1881. IRVING FISHER
Good Y Consumer’s Choice Indifference Curves Budget Constraint Good X Diagrammatic Utility Maximization IRVING FISHER
Good Y Slope = Price of X/Price of Y Production Possibilities Frontier Producer’s Choice Good X Production Possibilities Frontier • Fisher introduced the familiar graph of the Production Possibilities Frontier IRVING FISHER
Good Y Slope = Price of X/Price of Y Production Possibilities Frontier Producer’s Choice Good X Production • For the case in which the amounts used in production of the various resources are fixed, Fisher showed that the producer maximizes profits by producing at that point on the PPF that has slope equal to the price of the good shown on the horizontal axis in terms of the good shown on the vertical axis. IRVING FISHER
Taxation • He showed that a consumption tax is a better policy than an income tax (because it does not alter our incentives to save). IRVING FISHER
Aggregation • He derived an “ideal index” as the geometric mean of the Laspeyres and Paasche indices and justified its superiority through an axiomatic approach. IRVING FISHER
Interest rate • Fisher built on the ideas of John Rae and Eugen von Böhm-Bawerk to construct the modern theory of interest. • He did this by inserting the production possibilities frontier, the maximum value line, and the indifference curves in the same graph and re-labeling the two goods as consumption now and consumption later. • Along the way, he showed how the Walrasian general equilibrium model could contain behavior such as saving and investment. IRVING FISHER
Quantity theory of money • Although Fisher did not add to the classical Quantity Theory of Money, he expressed the theory by the now familiar equation M V = P T. • Here M is the quantity of money, V is the velocity of money or the number of times the average dollar changes hands in, say, any given year, P is the value of the average transaction, and T is the number of transactions. • For simplicity, the equation is sometimes expressed as M V = P Y. In this case, P is the average level of prices of final goods and Y is the gross domestic product.) • Fisher saw this equation as a tautology that becomes the Quantity Theory when V and T (or, Y) are assumed to be unaffected by changes in M. • In that case any change in M makes P change in the same direction and by the same percentage. IRVING FISHER
Fisher effect • Fisher showed that expected changes in asset prices have no effect on the economy • unexpected changes might have an effect. • Fisher clearly distinguished between real and nominal interest rates, and between expected and actual inflation in deriving the Fisher equation: • nominal interest rate = real interest rate + expected inflation. • He also made the argument that in the long run expected and actual inflation would be equal. IRVING FISHER
Fisher Effect • Fisher’s equation leads, by way of monetary neutrality, to what is known as the Fisher Effect • It is the prediction that an x percentage point change in the inflation rate will cause an identical x percentage point change in the nominal interest rate. • Fisher had argued—on empirical grounds—that the Fisher Effect would be true only in the very long run. IRVING FISHER
‘Phillips Curve’ • Also, based on his statistical calculations, Fisher had argued that there was a negative correlation between the rate of inflation and the unemployment rate, as far back as 1926. • This is the so-called Phillips Curve credited to A.W. Phillips, apparently in error. IRVING FISHER
Assesment • The first great American economist IRVING FISHER