Download
1 / 56
570 likes | 945 Vues
Demographic Transition and Age Structure. Variations in Population Growth. The Demographic Transition 1. Low growth – 3. Moderate growth 2. High growth – 4. Low growth Population pyramids Age distribution Sex ratio Countries in different stages of demographic transition

E N D
Variations in Population Growth • The Demographic Transition • 1. Low growth – 3. Moderate growth • 2. High growth – 4. Low growth • Population pyramids • Age distribution • Sex ratio • Countries in different stages of demographic transition • Demographic transition and world population growth
Earth’s Population History 6 billion reached 1999 (12 years later) 5 billion reached 1987 (13 years later) 4 billion reached 1974 (15 years later) 3 billion reached 1959 (29 years later) 2 billion reached 1930 (100 years later) 1 billion reached circa 1830 Source: Kuby, HGIA
Demographic Transition Model Explaining Spatial Patterns of World Population Growth
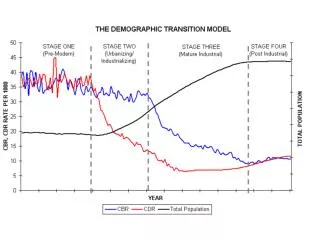
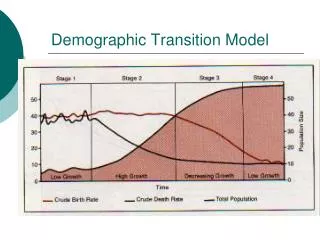
The Demographic Transition Fig. 2-13: The demographic transition consists of four stages, which move from high birth and death rates, to declines first in death rates then in birth rates, and finally to a stage of low birth and death rates. Population growth is most rapid in the second stage.
Stages in Classic 4-Stage Demographic Transition Model (DTM) (Some books show a 3-stage model; others mention a new 5th stage)
Stage 1: “Pre-Industrial” High birth rates and high death rates (both about 40) Population growth very slow Agrarian society High rates of communicable diseases Pop. increases in good growing years; declines in bad years (famine, diseases) No country or world region still in Stage One
Stage 2: “Early Industrial” High birth rates (over 30) but death rates decline (to about 20) RNIs increase sharply (pop. explosion); growth rate increases throughout Stage Two Growth not from increase in births, but from decline in deaths MDCs = starts early 1800s LDCs = starts after 1950s
TRANSITION TO STAGE TWO IN CLASSIC DTM Known as the Epidemiologic Transition Agricultural technology Improvements in food supply: higher yields as agricultural practices improved in “Second Agricultural Revolution” (18th century) In Europe, food quality improved as new foods introduced from Americas Medical technology Better medical understanding (causes of diseases; how they spread) Public sanitation technologies Improved water supply (safe drinking water) Better sewage treatment, food handling, and general personal hygiene Improvements in public health especially reduced childhood mortality
Stage 3: “Later Industrial” Birth rates decline sharply (to about 15) Death rates decline a bit more (to about 10 or less) Note growth still occurs, but at a reduced and declining rate MDCs = starts in late 1800s LDCs = starts after 1980s* * Or hasn’t started yet
Stage Three: Further improvements in medicine lower death rates more; raise life expectancies Measles Mortality, US, since 1900 TB Mortality, US, since 1900
TRANSITION TO STAGE THREE IN CLASSIC DTM Known as the Fertility Transition Societies become more urban, less rural Declining childhood death in rural areas (fewer kids needed) Increasing urbanization changes traditional values about having children City living raises cost of having dependents Women more influential in childbearing decisions Increasing female literacy changes value placed on motherhood as sole measure of women’s status Women enter work force: life extends beyond family, changes attitude toward childbearing Improved contraceptive technology, availability of birth control But contraceptives not widely avail in 19th century; contributed little to fertility decline in Europe … Fertility decline relates more to change in values than to availability of any specific technology
Rapidly increasing urbanization in world LDCs today Population Classified as Urban
Strong inverse relationship between female literacy and fertility rates, observed globally Increasing availability and use of modern contraception in most LDCs since 1970s
Stage 4: “Post-Industrial” Birth rates and death rates both low (about 10) Population growth very low or zero MDCs = starts after 1970s LDCs = hasn’t started yet Stage 5 (?): Hypothesized (not in Classic DTM) Much of Europe now or soon in population decline as birth rates drop far below replacement level
Demographic Transition in England Fig. 2-14: England was one of the first countries to experience rapid population growth in the mid-eighteenth century, when it entered stage 2 of the demographic transition.
Differences in DTM experience: MDCs & LDCs ● Faster decline in death rates — Tech improvements diffused from MDCs & applied rapidly in LDCs post-WW2 ● Longer lag between decline in deaths and decline in births — Stage 3 slower start in LDCs where econ growth is delayed ● Higher max rates of growth in LDCs — Over 3.5% peak RNI in Mauritius and Mexico; only 1.3% peak in Sweden
Age structures today in LDCs are much younger than MDCs experienced – leading to prolonged “Demographic Momentum” – expected growth of pop. long after fertility declines Percentage of Population Under Age 15
Summary of DTM for LDCs Industrializing LDCs with some economic development follow DTM more closely; now in Stage Three. Most like MDCs in places where female literacy has increased the most. Lowest-income countries have high birth rates and deaths are leveling off at higher rates than DTM predicts (Stage Two). In some LDCs, death rates starting to increase (epidemics, worsening poverty)
AZ: Breakdown by Ethnic Population Groups within MDCs may have varying pop patterns
Percent of Population under 15 Fig. 2-15: About one-third of world population is under 15, but the percentage by country varies from over 40% in most of Africa and some Asian countries, to under 20% in much of Europe.
Population Pyramids in U.S. cities Fig. 2-16: Population pyramids can vary greatly with different fertility rates (Laredo vs. Honolulu), or among military bases (Unalaska), college towns (Lawrence), and retirement communities (Naples).
Rapid Growth in Cape Verde Fig. 2-17: Cape Verde, which entered stage 2 of the demographic transition in about 1950, is experiencing rapid population growth. Its population history reflects the impacts of famines and out-migration.
Moderate Growth in Chile Fig. 2-18: Chile entered stage 2 of the demographic transition in the 1930s, and it entered stage 3 in the 1960s.
Low Growth in Denmark Fig. 2-19: Denmark has been in stage 4 of the demographic transition since the 1970s, with little population growth since then. Its population pyramid shows increasing numbers of elderly and few children.
Will the World Face an Overpopulation Problem? • Malthus on overpopulation • Population growth & food supply • Malthus’ critics • Declining birth rates • Malthus theory & reality • Reasons for declining birth rates • World health threats • Epidemiological transitions
Food & Population, 1950-2000Malthus vs. Actual Trends Fig. 2-20: Malthus predicted population would grow faster than food production, but food production actually expanded faster than population in the 2nd half of the 20th century.
Crude Birth Rate Decline, 1980-2005 Fig. 2-21: Crude birth rates declined in most countries during the 1980s and 1990s (though the absolute number of births per year increased from about 120 to 130 million).
Use of Family Planning Fig. 2-22: Both the extent of family planning use and the methods used vary widely by country and culture.
Cholera in London, 1854 Fig. 2-23: By mapping the distribution of cholera cases and water pumps in Soho, London, Dr. John Snow identified the source of the water-borne epidemic.
Tuberculosis Death Rates Fig. 2-24: The tuberculosis death rate is good indicator of a country’s ability to invest in health care. TB is still one of the world’s largest infectious disease killers.
Avian Flu, 2003 - 2006 Fig. 2-25: The first cases of avian flu in this outbreak were reported in Southeast Asia.
HIV/AIDS Prevalence Rates, 2005 Fig. 2-26: The highest HIV infection rates are in sub-Saharan Africa. India and China have large numbers of cases, but lower infection rates at present.
The Spread of AIDS in Africa • 20%-30% • 10%-20% • 5%-10% • 1%-5% • 0%-1% • data unavailable
HIV-AIDS Weakens the Immune System Opportunistic infections: • Pneumonia • Meningitis • Some cancers • Tuberculosis (TB) • Other parasitic, viral and fungal infections that weaken the immune system