Demographic Transition Model
Demographic Transition Model. Reasons for population change. Stage 1 High death rate - poor medical knowledge, diet, water supply and sanitation High birth rate - children used on farms, no reliable contraception Stage 2 Decreasing death rate - medical knowledge and diet improves


Demographic Transition Model
E N D
Presentation Transcript
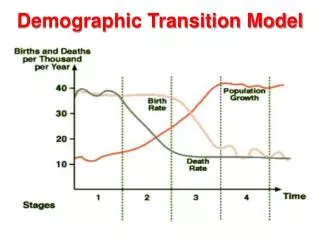
Reasons for population change Stage 1 High death rate - poor medical knowledge, diet, water supply and sanitation High birth rate - children used on farms, no reliable contraception Stage 2 Decreasing death rate - medical knowledge and diet improves High birth rate - still children used on farms, no reliable contraception Stage 3 Decreasing death rate - more medical advances, clean water, greatly decreased infant mortality Decreasing birth rate - children needed less on farms, people have smaller families when infant mortality decreases Stage 4 Low death rate - advanced medical services, good living conditions, increased health education Low birth rate - children cost money, contraception widely available, women gain higher status and control
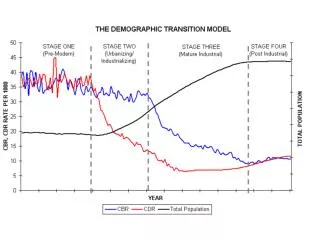
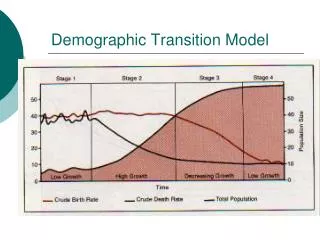
Stage 1 - High Fluctuating Birth Rate and Death rate are both high. Population growth is slow and fluctuating. Reasons Birth Rate is high as a result of: Lack of family planning High Infant Mortality Rate: putting babies in the 'bank' Need for workers in agriculture Religious beliefs Children as economic assets Death Rate is high because of: High levels of disease Famine Lack of clean water and sanitation Lack of health care War Competition for food from predators such as rats Lack of education Typical of Britain in the 18th century and some tribes today.
Stage 2 - Early Expanding Birth Rate remains high. Death Rate is falling. Population begins to rise steadily. Reasons Death Rate is falling as a result of: Improved health care (e.g. Smallpox vaccine) Improved hygiene (Water for drinking boiled) Improved sanitation Improved food production and storage Improved transport for food Decreased Infant Mortality Rates Typical of Britain in 19th century; Bangladesh; Nigeria today
Stage 3 - Late Expanding Birth Rate starts to fall. Death Rate continues to fall. Population rising. Reasons: Family planning available Lower Infant Mortality Rate Increased mechanization reduces need for workers Increased standard of living Changing status of women Typical of Britain in late 19th and early 20th century; China; Brazil today
Stage 4 - Low Fluctuating Birth Rate and Death Rate both low. Population steady. Typical of USA; Sweden; Britain today
Is the model universally applicable? Like all models, the demographic transition model has its limitations. It failed to consider, or to predict, several factors and events: 1 Birth rates in several MEDCs have fallen below death rates (Germany, Sweden). This has caused, for the first time, a population decline which suggests that perhaps the model should have a fifth stage added to it. 2 The model assumes that in time all countries pass through the same four stages. It now seems unlikely, however, that many LEDCs, especially in Africa, will ever become industrialised. 3 The model assumes that the fall in the death rate in Stage 2 was the consequence of industrialisation. Initially, the death rate in many British cities rose, due to the insanitary conditions which resulted from rapid urban growth, and it only began to fall after advances were made in medicine. The delayed fall in the death rate in many developing countries has been due mainly to their inability to afford medical facilities. In many countries, the fall in the birth rate in Stage 3 has been less rapid than the model suggests due to religious and/or political opposition to birth control (Brazil), whereas the fall was much more rapid, and came earlier, in China following the government- introduced ‘onechild’ policy. The timescale of the model, especially in several South-east Asian countries such as Hong Kong and Malaysia, is being squashed as they develop at a much faster rate than did the early industrialised countries. 4 Countries that grew as a consequence of emigration from Europe (USA, Canada, Australia) did not pass through the early stages of the model.
Life expectancy The number of years that a child born in a particular country in a certain year can expect to live.
Fertility rate The average number of births per woman.
Infant mortality The proportion of children who die before they reach the age of one year (sometimes before the age of five).
Population structure This refers to the age and sex distribution of the population.
Population Dependency Ratio Population Dependency Ratio Population Dependency Ratio
Countries with rapid population growth Countries with Rapid Population Growth • When a country's population growsquicklyit has the following effects • The large number of young people have to have services e.g. schools provided for them • There are fewer older people, so less money needs to be spent on them • There is a relatively small proportion of adults of working age; these people provide the wealth for • the services • There is pressure on the countryside with the extra population to feed; this can result in overgrazing, • over cropping and soil erosion • People move to the cities to find work; developing countries with rapidly growing populations have • the fastest growing cities in the world • Shanty towns grow up on the edge of cities; these are self-constructed buildings of poor quality • which can lack vital services such as water, electricity and sanitation • Some people apply to migrate to developed countries in order to improve their standard of living
Populations growing too quicklyThe steps that have been taken to reduce the problems caused by a rapidly growing population include Education about family planning, with the increased availability of a range of contraceptive methodsExtra taxes for parents who have large familiesExtra benefits for the parents that have only one or two childrenRaising the age of marriageIncreasing the industry and wealth in a country - this allows it to "afford" the increased populationWhen a country develops - that is has a higher quality of life, higher standard of living and increased wealth - the birth rate goes down. This is the greatest influence in reducing problems caused by rapid population growth.
Countries with Slow Population Growth • When a country's population grows slowly it has the following effects • It has an ageing population, so large amounts of money is spent in providing services, • e.g. healthcare, for older people • As there is fewer young people less money needs to be spent on this age group • There could be a shortage of workers in the future, with so few young people • Migrants move into the country, often to work in the low paid, low status jobs that would • otherwise be difficult to find workers for
Populations growing too slowly • Governments have been concerned when the population of their country is only growing slowly. Indeed some countries, e.g. Hungary and Germany have recently had population decline. • The governments have responded by • Giving mothers longer paid maternity leave; giving • paternity leave to fathers • Generous child benefit payments • Raising the age of retirement - this increases the • workforce and reduces the amount that has to be • spent on pensions
Population pyramidsPyramid 1: Here the base is very wide indicating a very high birth rate. The width drops off very quickly. This means people must be dying. Very few reach old age. Few countries are still in this stage today but some rainforest populations would display this pattern. Implications: Clear need for investment into water supplies, health care, food supplies and housing to reduce death rates. • Population pyramid for Mozambique 2000 • In this graph, notice that in 2000 the 0-4 age group contained the largest number of people, with the numbers thereafter declining steadily as the ages increase. The graph matches stage 1 in the model.
Pyramid 2: Still a large base so high birth rate but also a wider and taller pyramid as more people are living to older ages. This is stage two of the demographic transition model and includes many countries in Africa such as Kenya.Implication: Probable need to invest in education about family planning to reduce birth rate. Possibly indicates that women are undervalued in society so this could be tackled. • Projected population pyramid for Mozambique 2025 • In the second graph, the largest group in Mozambique in 2025 is still the 0-4 age group, but there are nearly as many people in the 5-29 age groups. Now the population pyramid matches stage 2. matches stage 2.
Pyramid 3: Note the more ‘domed’ shape. It means many people are living to older ages as quality of life improves. There are also proportionately fewer births. This is stage three of the demographic transition model. Chile would be a good example.Implication: As the population becomes increasingly older there may be a need to invest in facilities and services for them. Still a need for continued investment in family planning.
Pyramid 4: Very small base due to the very low birth rates and death rates displayed in the wide top. This would be representative of Australia that has recently come through stage three of the demographic transition model.Implication: Should the situation continue there are serious implications about providing for the elderly population (increasing cost of health care, state pensions) especially as the working population becomes proportionally smaller. This is a major concern in much of the developed world. • Population pyramid for the UK 2000 • Notice how in the UK 2000 pyramid there is a bulge in the area of the 30-34 and 35-39 age groups, with the numbers thereafter reducing fairly steadily as the ages increase. This matches stage 4 of the demographic transition model.
Projected population pyramid for the UK 2025 • Compare this to the 2025 pyramid, which would be stage 5 in the model. Here the bulge extends much further, covering the age groups 30-64, with the numbers beginning to reduce significantly only after 64.
Population pyramids can also be influenced by: • Migration: Likelihood of extra young males as these are likely to migrate. • Famines: Clear drops in population especially among the very young as these are most likely to suffer. • War: Clear drop off in male populations of fighting age. Make sure you can read data from a pyramid – try the one in the questions section.
Population pyramids can also show the percentage of the population, which is described as being "dependant". These are the groups of people who rely on the economically active members of society. Dependants are classified as those under working age (0 - 15 years old) and those who have retired (over 65). They rely on the working age group of people between 16 and 64. Population pyramids can also show significant events. In Germany there are far more males between 20 and 35, than there are females of a similar age. This shows up quite clearly on a pyramid, and is due to the huge numbers of male immigrant workers that came into the country through the 1990's. They came to Germany to find work, and left their families at home in places such as Yugoslavia and Turkey. Another type of event that can be traced easily on population pyramids, is the effect of war. Often this leads to large in-balances in the population, with far more women than men of fighting age remaining as the men have been killed in battle. Population pyramids can be used to help planning for the future also, as they can used to project the percentages of certain age-groups in the population over the next 50 years. In this way plans can be introduced to cope with the forecast changes, such as the ageing population in the UK.