Download
1 / 26
260 likes | 348 Vues
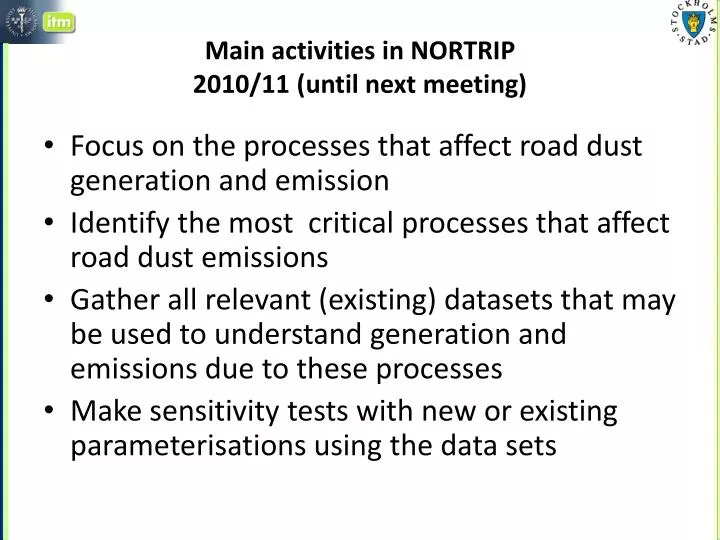
Main activities in NORTRIP 2010/11 ( until next meeting). Focus on the processes that affect road dust generation and emission Identify the most critical processes that affect road dust emissions

E N D
Main activities in NORTRIP 2010/11 (untilnext meeting) • Focus on the processesthataffect road dust generation and emission • Identify the mostcriticalprocessesthataffect road dust emissions • Gather all relevant (existing) datasetsthatmay be usedtounderstand generation and emissions duetotheseprocesses • Make sensitivity tests with new or existingparameterisationsusing the data sets
Agenda • 9 – 10 Coffee buffé is served • 10 – 12 NILU and SMHI road dust emission models (Bruce and Gunnar) • Current parameterizations of important processes • Urgently needed improvements of existing parameterizations • Urgently needed new parameterizations • 12 – 13 Lunch • 13 – 15 Experimental data and proposed parameterizations for PM10 emissions due to influence of: • Pavement and tire type (VTI) • Sand/salt (FMI) • Road wetness (SLB) • Wind and traffic induced suspension (DMU) • Vehicle speed (SLB/ITM) • Studded tyre share (SLB/ITM) • Any other process (all) • 16 – 17 Conclusions, how to proceed with model testing and validation • 14.30 – 16 Coffee buffé is served
VTI road test facility Several test roads Different pavements Different tyres Gustafsson et al.
SpeedEmission measurementusing EMMA Mixed rural roads Both suspension and direct emission
Reduced speed on RV4Oslo (NILU) • In 2005, relative to 2004: • Traffic volume on Rv4 was reduced by 3% • 10% less studded tyres • Measured speed was reduced by 12 km/h Foto: Aftenposten, Tor Richardsen
Reduced speed on RV4Oslo (NILU) • Changed concentration on RV4 compared to other station without reduced speed limit: • PM10: - 36 % • PM10, max hour: - 30 % • PM10, max daily: - 20 % • PM coarse fraction: - 39 %(Road dust)
Speed dependent PM10 emission factormultiplelinear regression of road side data mgPM10/vkm per 10 km/h Road tunnel Motor- way Motorways Johansson et al., 2010
Impact on PM10of speed reductions Johansson et al., 2010
Studded tyresVTI road test facility Gustafsson et al.
Tyre typeVTI road test facility Studded winter tyres 30 km/h 50 km/h 70 km/h Non-studded Nordic winter tyres Summer tyres Gustafsson et al.
Studded tyresSödra länken road tunnel • Measurementsof PM10/Noxratio => emission factor =f(studded tyre share)
Ban on studded tyres reducedamountoftraffic Hornsgatan Christmas Holiday Summer Holiday • Trafikenminskade med 25 % jan – apr 2010
Reducedstudded tyre sharedueto ban Förbud från 1 jan 2010 Förbud • ~40 % avfordonen hade dubbatpåHornsgatan • ~50-55 % påandra gator och 65 % påinfarterna
Studded tyre influence on emissions in streetcanyons • ~40% lägreemissioner under Jan-Mar • ~15-20 % lägreemissioner under helaåret Samband mellan PM10 halter och dubbandel: Veckomedelvärden av PM10 halterna som funktion av dubbandelen Okt –Dec 2003
Studded tyre fees in Norway • Study from 2001 shows that:10 % reduction (absolute) studded tyres 1 µg PM10/m3 reductionwinter season mean value • Impact on emission factor?
Rullande veckomedelvärden ug/m3 2009/10Snörik vinter => färre överskridande 2007 2009 2008 2010 Antal dygn >50 ug/m3 2008 2009 2007 2010
BetongbeläggningEmissionsmätning Betong ger 25% - 30% lägre emission med dubbdäck Johansson et al, 2009
Bullerdämpande beläggningEmissionsmätning Bullerdämp. Referens Mängden suspenderbart material vägytorna viktigare än beläggningsegenskaperna Johansson, 2010