Scr
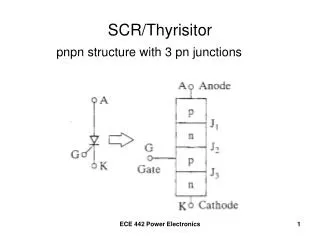
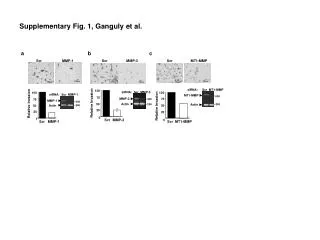
Supplementary Fig. 1, Ganguly et al. a. b. c. Scr. MMP-1. Scr. MMP-3. Scr. MT1-MMP. 100 m m. 100 m m. 100 m m. 100 m m. 100 m m. 100 m m. siRNA: Scr MT1-MMP. siRNA: Scr MMP-3. 100. 100. 100. siRNA: Scr MMP-1. MT1-MMP. 600. MMP-3. 75. 400. Relative Invasion.

Scr
E N D
Presentation Transcript
Supplementary Fig. 1, Ganguly et al. a b c Scr MMP-1 Scr MMP-3 Scr MT1-MMP 100mm 100mm 100mm 100mm 100mm 100mm siRNA: Scr MT1-MMP siRNA: Scr MMP-3 100 100 100 siRNA: Scr MMP-1 MT1-MMP 600 MMP-3 75 400 Relative Invasion 75 MMP-1 Relative Invasion 75 300 Relative Invasion Actin 200 Actin 200 Actin 200 50 50 50 25 25 25 0 0 Scr MMP-1 Scr MMP-3 Scr MT1-MMP 0
Supplementary Fig. 2, Ganguly et al. STI571: - + MMP-1 300 Actin 200 100 75 Relative MMP-1 expression (MMP-1/b-Actin) 50 0.25 0 STI571: - +
Supplementary Fig. 3, Ganguly et al. GST: GST-Crk GST-STAT3 GST 182 Autophosphorylated c-Abl/Arg 115 GST-STAT3 82 64 GST-Crk 49 37 26 GST IP: Abl PP Abl PP Arg PP Abl PP Arg PP Arg PP
Supplementary Fig. 4, Ganguly et al. Primers: Abl Arg Cell Line: GFP GFP-MMP-1 GFP GFP-MMP-1 siRNA: Scr Abl Arg Scr Abl Arg Scr Abl Arg Scr Abl Arg Abl/Arg Actin Percent of: 100 44 76 100 35 103 100 121 14 100 166 18 Scrambled
Supplementary Fig. 5, Ganguly et al. a b 40 14 12 30 10 3H-Thymidine Incorporation (CPM X10 4) 8 3H-Thymidine Incorporation (CPM X10 4 ) 20 6 4 10 2 0 Scr STAT3 pcDNA STAT3C 0 siRNA: Scr Arg Scr Arg c pcDNA STAT3C STI571: - + - + 500 115 400 PARP blot 300 Relative PARP Cleavage (PARP/b-actin) Cleavage product 82 200 Percent of Untreated: 100 437 100 270 49 100 b-actin blot 0 pcDNA STAT3C STI571: - + - +
Supplementary Fig. 6, Ganguly et al. Treatment/Starvation Time: 48h 96h STI571: - + - + - + 115 PARP blots Cleavage product 82 37 b-actin blot GAPDH blot 37