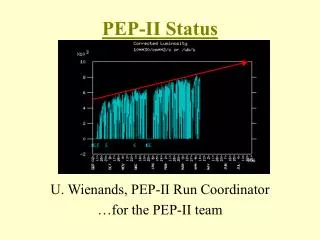
PEP Finance Briefing
150 likes | 355 Vues
PEP Finance Briefing. June 23, 2011. Agenda. FY12 Budget Overview FY12 Budget Cut Title I Allocations Fair Student Funding Formula Hot Topics. FY12 Overview.

PEP Finance Briefing
E N D
Presentation Transcript
PEP Finance Briefing June 23, 2011
Agenda • FY12 Budget Overview • FY12 Budget Cut • Title I Allocations • Fair Student Funding Formula • Hot Topics
FY12 Overview • The FY12 Department of Education budget contains a $2 billion increased revenue commitment from New York City to cover the loss of $853 million in Federal stimulus funds and the State's $812 million cut to education. • The City has saved schools from the funding cliff caused by the loss of Federal stabilization funds expiring this June and reductions in State revenues.
Revenues Since the beginning of the Bloomberg Administration, City-funded spending on education has more than doubled from $5.9 billion in FY 2002 to the $13.4 billion proposed in the Mayor’s FY12 Executive budget. As a result, City funds, as a share of the non-federal DOE budget, have grown from 51% in 2002 to 61% in FY12 while State funding has fallen from 49% to 39% over the same period.
Expense Budget Major Year-Over-Year Changes in DOE Budget School Districts 1-32,79: Net $65 million reduction reflects $370 million PEG and loss of ARRA funds in UAs 401/2 with partial offset by City restoration funds Categorical Budgets : Net reduction of $454 million due to loss of ARRA funds in these UAs plus baseline revenue adjustments Support & Central: Reduction in Facilities budget due to loss of revenue (SCA & Federal) plus PEG; Growth in Central budget due to restoration of $37 million in FY12 with expiration of one-year PEG in FY11. Special Education: Over $400 million in increases in UAs 403/4; 421/2;423/4; 470 and 472 reflect growing demand and increasing costs Charters: Net increase of $165 million due to register increase of nearly 11,000 pupils, with 15% of the increase due to 13 new schools
FY12 Budget Cut Additional city funds will fill the Federal and State revenue gap in FY12 and help meet some of the rising costs, but the new city revenue will not cover all of these expenses. Many of the rising costs are tied to State and Federal mandates that have little to no flexibility and often come without commensurate funding. • Pensions, which will grow 20% or $490 million; • “Pass through” special education costs for non-DOE pupils will grow 21% or $331 million; • Fringe costs will grow by 5% or $141 million; • Transportation will grow 11% or $108 million • DOE special Education costs will grow by 4% or $93 million
FY12 Budget Cut • To fund these unavoidable increases, even taking account of NYC’s added $2 billion, requires budget reductions in non-mandated, more flexible areas of the DOE budget. • This table, based upon DOE’s FY11 budget, shows that less than half of DOE’s budget is flexible.
FY12 Program to Eliminate the Gap (PEG) School PEG Non-School PEG
CUMULATIVE REDUCTIONS THROUGH FY12 EXECUTIVE BUDGET • From 2008 through the FY12 Mayor’s Executive Budget, the Education Department will have cut 38% of the budget for its central and field offices, for a savings of nearly $250 million. Cuts have also been applied to facilities, transportation and food (see “Indirect School Impact” below) totaling $166 million over this period. A total of 705 non-school positions have been eliminated, including 211 layoffs. Schools will have absorbed budget cuts of $1.3 billion, or 17.5% through the current FY12 executive budget.
Title I • Title 1 Eligibility has been restored to the historic criteria of 60% Free Lunch. • Schools receiving Title I ARRA in FY11 will be restored for this funding stream at a rate dependent on a school’s funding position relative to its FSF formula. • No school in the system will lose more than 1.5% of its flexible budget.
Fair Student Funding: FY12 Goals • Minimal FSF Formula Changes • Adjust Academic Weight to better support struggling students in accordance with new state standards. • Align Special Education Weights for ICT with instructional models for grades 1-8, rather than the kindergarten model used in the current FSF formula. Adjust SC Weight for HSs to better reflect current practice. • Minimize Changes in school budgets from FY11 to FY12 due to: • Loss of ARRA • Formula Revisions • Enhance Equity Between Schools • Increase budgets for schools well below FSF Formula • Stabilize schools moderately below FSF Formula • Cap loss for schools near and over FSF Formula
FSF Weight Changes • Fair Student Funding Changes • Minor Academic Intervention and Special Education Formula Changes: • Update Academic Intervention Support (AIS) Weights to better support struggling students in accordance with new state standards. The FSF Academic Intervention Poverty Weight will change from .24 to .12 and the way FSF counts pupils as proficient will be revised to account for NYS re-scaling of test scores. As can be seen on the chart to the right, the proposed method will bring AIS funding closer to the level of academic need. • Align Special Education Weights for Self-Contained and ICT with instructional models as outlined in compliance guidance. The SC weight for grades 9-12 will change to support classrooms of 15 pupils instead of the current 12 pupils. ICT weights for all grades except kindergarten will change to reflect classrooms of 12 special education pupils rather than 10 pupils in the current FSF weight. This will decrease the system-wide cost by reducing the need for additional classes while adhering to compliance guidelines. NOTE: These changes are within state and collective bargaining guidelines. 12
FSF Weights REVISED ORIGINAL
Enhance Equity and Maintain Stability • The City has restored the loss of federal funds to New York City Schools. The DOE is using these funds to adjust the FSF implementation method in order to increase funding to the most under-funded schools, with a cap on any the loss for all schools. • Schools that receive restoration funds that, combined with FSF funds, would result in budgets of 90.3% or more of the revised FSF formula will see a minimal loss of funding, not to exceed 1.5% of their major FY11 tax levy allocations. • 624 schools lose on average $45,774 or 1.5% of their major FY11 tax levy allocations • Schools that receive restoration funds that, combined with FSF funds, would result in budgets that are between 83% and 89% of the revised FSF formula will see no reduction in the amount of restoration funding that backfills their FY11 ARRA funds. • 578 schools have no change • Schools that receive restoration funds that, combined with FSF funds, would result in budgets that are less than 82.7% of the revised FSF formula will see no reduction in the amount of restoration funding that backfills their FY11 ARRA funds, PLUS they will receive additional restoration funds to bring them up to 84.9%, but no school can gain more than 10% of the value of their major FY11 tax levy allocations. • 279 schools gain an average of $147,306 or 3.5% of their major FY11 tax levy allocations
Hot Topics • DPPI • Layoffs • Contracts/Procurement