Exploring Data Journalism: From Concept to Compelling Storytelling
350 likes | 473 Vues
This comprehensive guide by Steve Doig from the Cronkite School of Journalism at Arizona State University outlines the essential components and processes of data journalism. It emphasizes the importance of data in storytelling, the steps to uncover data-driven ideas, and methods for data collection and analysis. The guide covers variable types, data cleaning techniques, and collaboration among various team members, such as reporters, editors, and designers. It encourages journalists to utilize public records and technological tools effectively, ensuring impactful storytelling through data.

Exploring Data Journalism: From Concept to Compelling Storytelling
E N D
Presentation Transcript
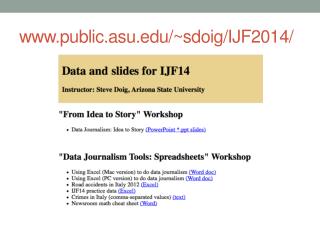
Data journalism:From idea to story Steve Doig Cronkite School of Journalism, Arizona State University steve.doig@asu.edu @sdoig
Work backwards from your idea! • What statements do you want to make? • What variables are needed to make those statements? • Who would collect data with those variables? • How will you get the data from the collector?
1. Statements? • Lede = hypothesis • Bullet points = statements • Examples for a crime and courts data story: • “Crime has increased/decreased X % since...” • “The X per 100.000 violent crime rate of Y City is the worst ...” • “Only X % of reported crimes result in arrests...”
2. Variables needed? • Columns = variables • Rows = records • Two main kinds of variables • Categorical: Sex, city, postal code, type of crime, etc... • Numeric: Age, cost, population, weight, arrests, accident, etc...
Avoid PDFs...but if necessary... • Convert to *.xls with: • Acrobat Pro • Zamzar • CometDocs • (many others)
You have data... ...Now what??
Excel tools • Sort • Filter • Functions • Pivot tables
Data journalism team • You! • Other reporters • Editors • Graphic artists • Photographers • Videographers • Page designers • Web designers • App developers