Download
1 / 26
260 likes | 364 Vues
Explore the trends, drivers, and potential solutions for nutrient pollution in coastal waters, focusing on the impacts of nitrogen on eutrophication and hypoxia. Learn about global nitrogen cycles, regional perspectives on nutrient management, and technical solutions to reduce pollution from agriculture, vehicle emissions, power plants, and sewage treatment. Discover the importance of policy interventions related to diet and biofuels in combating nitrogen pollution globally.

E N D
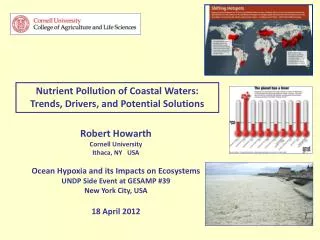
Nutrient Pollution of Coastal Waters: Trends, Drivers, and Potential Solutions Robert Howarth Cornell University Ithaca, NY USA Ocean Hypoxia and its Impacts on Ecosystems UNDP Side Event at GESAMP #39 New York City, USA 18 April 2012
Global status of earth’s 10 life-sustaining biophysical systems nitrogen (Rockstrom et al. 2009)
Nitrogen (and not phosphorus) is the primary culprit for coastal eutrophication and hypoxia(although controlling both is best policy)
+ phosphorus + nitrogen + nitrogen & phosphorus No nutrients added Oviatt et al. 1996
Seine and Scheldt Basins and Belgian coast of North Sea North Sea English Channel
Freshwater discharge Seine River basin TN load TP load
Chlorophyll in North Sea on Belgian coast Seine River N load Scheldt River N load
Global trends in nitrogen use per year Total human inputs Natural N fixation on the continents Fertilizer N fixation in agro-ecosystems Fossil fuel burning (modified from Howarth et al. 2005)
Regional scale perspective important for nutrients. Changes are driven by global energy and agricultural policies. But with exception of N2O, nutrient cycles are altered at local to regional scales, not global scales, and effects are manifested at these local to regional scales.
New York Times (4/30/08) Townsend & Howarth 2010
Natural background flux Republic of Korea North Sea watersheds Northeastern U.S. Yellow River basin Mississippi River basin Baltic Sea watersheds St. Lawrence River basin Southwestern Europe Labrador and Hudson’s Bay Flux of nitrogen from the landscape to coastal oceans in rivers for contrasting regions of the world in the temperate zone (kg per km2 of watershed area per year; from Howarth et al. 2005).
North Atlantic Ocean Kg N km-2 year-1 NANI (net anthropogenic N inputs) International SCOPE N Project (Howarth et al. 1996)
(Howarth et al. 2012) ~ 150 watersheds on two continents ~ 25% of NANI exported to coastal oceans on average from 150 watersheds in Europe and the US
Chinese watersheds Swaney et al. 2012
NANI Hong et al., 2012 NOy deposition Fertilizer Ag N fixation Net food & feed
Per capita NANI by region (partial analysis) UNEP Sustainable Resource Use Panel (2011 draft)
Technical solutions for nitrogen pollution: • Agricultural fields: reduce fertilizer amount and timing; change cropping systems; plant winter cover crops; control drainage seasonally • CAFOs: treat wastes as society does for human waste • Vehicle exhaust: tighten emission standards; encourage hybrid vehicles and electric vehicles • Power plants: tighten emission standards; encourage renewable electricity (solar, wind) • Sewage treatment: require denitrification treatment Howarth et al. (2005) Millennium Ecosystem Assessment
But also think about policy solutions, particularly regarding diet and biofuels….
NH3 Denitrified? Building up in soil? NH3 Landfilled? Leached? Landfilled? Denitrified? 0.2 (4.2) (1.2) (0.8) Human Consumption 1.3 1.9 18.5 1.4 Field Level 10.5 Harvested in crops 0.9 Wastewater & Denitrified 5.9 3.6 2.1 Animal Consumption (3.1) Exported from U.S. Leached to water Leached to water? Denitrified? Farm nitrogen balance for US (~1995; Tg per year for entire US) (Howarth et al. 2002)
If everyone in the US ate this: Instead of this: (Howarth et al. 2002) The country would use only 1/3rd as much fertilizer, and would have much less nitrogen pollution!
Biofuels 15 billion liters Howarth et al. 2009
2009: National goal to reduce nitrogen pollution down Mississippi River by 45% to limit size of dead zone. Several models indicate national ethanol policy will make this difficult or impossible, and instead nitrogen pollution likely to increase…. 30% to 40% or more (Donner and Kucarik 2008; Simpson et al. 2008, 2009; EPA 2009; Costello et al. 2010)
Predicted Nitrogen Load from Mississippi River basin to meet US Ethanol Targets (Costello et al. 2010) 2015 targets 2022 targets 2.0 National target to reduce area of Dead Zone Million tons nitrogen per year 1.0 0 EtOh from corn plus cellulosic (corn stover) EtOh from corn plus cellulosic (switchgrass) Cellulosic EtOh only (switchgrass) No biofuels
CONCLUSIONS:Nitrogen is the primary culprit.Nitrogen pollution is growing globally, with agriculture as the primary driver.Technical solutions exist, and can help, often at little cost.But policy considerations of diet (meat!) and energy (liquid biofuels!) are critical.
Thanks for invitation to participate! • Thanks for many collaborators, especially: • Dennis Swaney • Bongghi Hong • Roxanne Marino • Christine Costello • Gilles Billen • Josette Garnier • Christoph Humborg • Alan Townsend Coastal Hypoxia Research Program Agriculture, Energy & Environment Program at Cornell University