Using Observations to Improve Hurricane Initialization
This research by X. Zou from Florida State University explores the critical role of vortex bogussing in hurricane initialization, emphasizing its necessity due to inadequate observational data. The study discusses how to create a bogus vortex that aligns with dynamical and thermodynamical conditions, ensuring accurate hurricane intensity and structure representation. Employing a 4D-Var approach and empirical methods, the study shows that proper vortex initialization significantly improves hurricane track and intensity forecasts, leading to better disaster preparedness and response strategies.

Using Observations to Improve Hurricane Initialization
E N D
Presentation Transcript
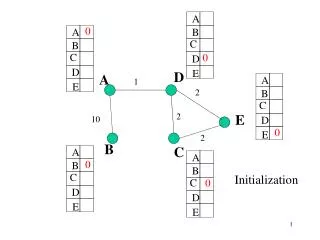
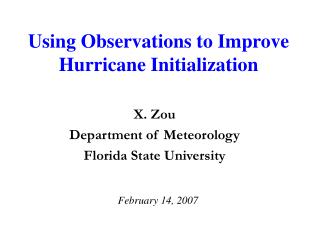
Using Observations to Improve Hurricane Initialization X. Zou Department of Meteorology Florida State University February 14, 2007
Outline . Hurricane Initialization . (Vortex bogusing schemes) Hurricane Observations . (Potential applications) A 4D-Var Approach . (Vortex bogusing and/or data assimilation) Numerical Results (Hurricane forecast impact)
Hurricane Initialization Using Bogus Vortex . Why is bogus vortex needed? . How is vortex bogussing done? . What is the forecast impact?
Bogus Vortex An artificial initial vortex which is conceptually correct and is specified based on a few available observational parameters, an empirical structure of a model variable and dynamic and thermodynamic constraints Vortex Bogussing Creation of a bogus vortex
Conditions for Bogus Vortex Specification The structure of the vortex should be dynamically and thermodynamically consistent Wind and mass fields in balance Coherent moisture field Size and intensity of the real TC should be represented Real storms evolving in different environmental conditions possess unique size and intensity The bogus vortex is compatible with the resolution and physics of the prediction model Prevent false spinup
Why is a bogus vortex needed? • Observations within and around hurricanes could be either insufficient or problematic Radiosonde observations are not over oceans. Rain contamination with QuikSCAT surface winds Cloud contamination with satellite radiances • Initial vortices in model initial conditions are often too weak and misplaced • Having an initial vortex at correct location with realistic intensities and structures is important for hurricane track and intensity forecasts
How is vortex bogussing done? • Specify a bogus vortex of a single variable Rankine vortex --- tangential wind Fujita’s vortex --- sea-level pressure Holland’s vortex --- seal-level pressure • Generate a dynamically and thermodynamically consistent initial vortex of all model variables Traditional method: Simplified dynamical constraints
An Early Method Used at NCEP Mukut B.Mathur. 1991: The National Meteorological Center's Quasi-Lagrangian Model for Hurricane Prediction. Monthly Weather Review, 119, 1419-1447.
1) Specify an empirical surface pressure field with observed > pressure at the vortex center (pc) > pressure of the outermost closed isobar (poutat r=Rout) > pressure of the hurricane environment 2) Derive vortex fields of other model variables >surface wind speed using the gradient wind relation (GWR) >3D wind speed from surface wind using empirical vertical structure functions >3D geopotential from 3D wind speed using GWR >3D wind vector from geopotential using GWR with variable f >virtual temperature from geopotential using the hydrostatic eq. >relative humidity (RH) by a linear interpolation assuming a saturated vortex center and a lower value of RH at Rout
An Early Method Used at NCEP 1) Specify an empirical surface pressure field with observed 2) Derive vortex fields of other model variables 3) Merge vortex fields with the gridded large-scale analysis where
NCEP analysis Prescribed bogus vortex Figure 1 from Mathur (1991) Hurricane Gilbert (1988) at 1200 UTC 14 September Large-scale analysis: • The maximum wind is located far from the center (>300 km) • Little evidence of a warm core Prescribed bogus vortex: • Strongest cyclonic winds close to the center • A warm core with a large warm temperature anomaly in the middle and upper troposphere Potential temperature (solid line, unit: K) Normal component of wind velocity (dashed line, unit: m/s)
48-h forecast without bogus vortex Hurricane Gilbert (1988) at 1200 UTC 16 September The 48-h forecast with bogus vortex is characterized by 48-h forecast with bogus vortex • Stronger wind • Warmer temperature • Deeper hurricane Figure 2 from Mathur (1991) Figure 2 from Mathur (1991)
A GFDL Method YoshioKurihara, Morris A.Bender and Rebecca J.Ross, 1993: An Initialization Scheme of Hurricane Models by Vortex Specification. Monthly Weather Review, 121, 2030-2045. Morris A.Bender, Rebecca J.Ross, Robert E.Tuleya and YoshioKurihara. 1993: Improvements in Tropical Cyclone Track and Intensity Forecasts Using the GFDL Initialization System. Monthly Weather Review, 121, 2046-2061.
The task of GFDL vortex initialization is completed by adding (IC) =(GA) - (vortex in GA) +(specified bogus vortex) Environmental field hE hsv
Main procedures • Obtain the environmental fields by removing often poorly analyzed tropical cyclone vortex from the large-scale analysis • Specify a symmetric vortex tangential wind field • Generate a symmetric vortex of all variables using an axisymmetric hurricane prediction model, with a nudging term imposing the specified tangential wind field • Obtain an asymmetric component of wind from integrating a simplified barotropic vorticity equation initialized by the symmetric tangential wind (Capture the asymmetric structureof TCsdue tothe planetary vorticity advection by the symmetric flow within the vortex) • Readjust mass fields to a state of balance to the asymmetric wind using divergence equation
Improved Hurricane Track Forecast (include seven cases of Atlanta storms) Figure 6 from Kurihara et al. (1993)
Hurricane Observations . . Radar data Radiances . . Dropsonde TOMS ozone . . QuikSCAT GPS RO Challenges and potential applications
. Information Radiances hydrometeor, temperature . TOMS ozone tropopause height . GPS RO high-vertical-resolution profile of . atmospheric refractvity Radar data high resolution radial wind and . refractivity Dropsonde atmospheric vertical profiles . QuikSCAT surface wind
85V Tbs for Hurricane Bonnie at 00 UTC 24 Aug 1998 Model simulated (30km) SSM/I obs. (18 km) 18 km The maximum difference ofTb at 85GHz within Hurricane Bonnie>100 K. The difference of maximumTb at 85GHz within Hurricane Bonnie>40 K.
RTM Improvements The RTM includes effects of absorption, emission, scatter, and multi-scattering (Liu, 1998). In the original version, the ice particles and air had been assumed a homogeneous mixture with the dielectric constant of the ice particle and the volume of the mixture considered as a solid sphere with the mass of the ice particle. In the modified version, the Maxwell-Garnett mixing formula is used for the calculation of the dielectric constant for ice particles. In the modified version, the values of the intercept parameter N0of the drop size distribution and the density ρ of the hydrometeor are made more consistent with the values of these parameters in the explicit moisture schemes. � � � � � � � �
6 km 6 km Tb at 85 GHz for Hurricane Bonnie (8/25 00 UTC, 1998) 18 km Reisner scheme 1 Reisner scheme 2 6 km 6 km SSM/I The maximum Tb difference < 20 K Goddard scheme Schultz scheme
Hurricane Erin observed by TOMS ozone on 15UTC 12 September 2001
GHT340K TOMS ozone SLP Tropical depression 6 Sept. 2001 Tropical storm 8 Sept. 2001 Hurricane category 3 10 Sept. 2001
Scatter plot for TOMS O3 and geopotential at 340 K (All data within 650-km radial distance for all 12 chosen hurricanes are included)
Case-dependent radial mean TOMS O3 versus GHT340K profiles Radial mean GHT340K (gpm) Radial mean TOMS ozone (DU)
Case-dependent radial mean TOMS O3 versus GHT340K with daily means subtracted from both fields Radial mean GHT340K (gpm) Radial mean TOMS ozone (DU)
A linear regression model for hurricane initialization using TOMS ozone STDE=176m (~1-2%)
Hurricane Erin on September 10, 2001 TOMS ozone Large-scale analysis Geopotential field at 340K with O3 data incorporated
. Challenges Radiances large model/observation difference . TOMS ozone not directly linked to model variables . GPS RO too little data within a hurricane . Radar data too high resolution with limited coverage . Dropsonde not available above flight levels and . within extreme weathers QuikSCAT rain contamination
A 4D-Var Approach for Bogusing Vortex and/or Data assimilation Advantages: . • Indirect remote-sensing observations can be assimilated simultaneously while generating bogus vortex . • The best dynamic and thermodynamic constraint --- hurricane forecast model --- is imposed within bogus vortex. • Diabatic effect is included
A 4D-Var Vortex Bogus Scheme Procedures: • Specify a bogus SLP. • Generate fields of all model variables • describing an initial vortex by fitting • a hurricane forecast model to the bogus SLP. Key features: (i)A bogus SLP field can be specified based on TPC (tropical prediction center) observed parameters. (ii) A 4D-Var assimilation window as short as 15-30 minutes is sufficient for this vortex initialization.
Specification of a Bogus SLP Fujita’s Formula: (linear regression model) where pc --- Central SLP pout--- Pressure of the outermost closed isobar Four observed TPC parameters Rout --- Radius of the outermost closed isobar R35kt --- Radius of the 35kt wind
Sensitivity studies suggest: . . Differences in the size of real hurricanes are appreciable. Hurricane track and intensity forecasts are sensitive to specified size of initial vortex. TPC Observed (known) Input to Fujita’s formula Linear regression model? Hurricane forecast model- derived R0, Rmax,R35kt, …..
A TPC parameter Size SpecificationforInitial Vortex 17 cases: Felix (1995)-1 Opal (1995)-1 Fran (1996)-3 Erika (1997)-1 Bonnie (1998)-9 Floyd (1999)-2 needed for vortex size specification
Numerical Results: Impact on Hurricane Forecast Applying a 4D-Var vortex bogusing to the prediction of Hurricane Bonnie (1998) and Hurricane Alberto (2000) Assimilation of microwave radiance for the prediction of Hurricane Bonnie (1998)
Initializing Hurricane Bonnie at 12 UTC August 23, 1998
EH Holland EF1 Fujita R0= 25 km=Rmax EF2 Fujita R0= 93 km Hurricane Bonnie (1998) Hurricane initialization time: 12 UTC, 23 August 1998 TPC observed parameters: Pc = 958 hPa, Rmax=25 km, Vmax=100kt, R34kt=255 km, Numerical Experiments: Model: MM5 at 18-km resolution Linear regression model
Radial profiles Large-scale analysis Radial profile of the bogus SLP 1000 EH EF1 EF2 958 958 958
Wind Increments at 850 hPa after 4D-Var BDA Wind increments at 850 mb after BDA with R0=34 km u’ v’
0 1 East-west cross sections of the difference between EF2 and analysis at 6-h interval East 420km 30min Time West 420km Pressure Perturbation -40 -18 4 hPa Temperature -4 8 20K
East-west cross sections of the divergence increments after hurricane initialization 0-30 min 30-60 min
Bogusing - pp At t0, hydrostatic balance dominates. Upper-level convergence Less denser air Adiabatic warming Warming Low-level divergence
Low At tR, dynamic balance dominates. Upper-level divergence Latent heat Warming Low-level convergence
East-west cross sections of the difference between EF2 and large-scale analysis of mixing ratio 0 1 East 420km 30min 60min Time West 420km 0-30 min 30-60 min
Track Track error Central pressure Maximum wind speed
Assimilation of Satellite Radiance • Initialization time: 1200 UTC 23 August 1998 (Hurricane Bonnie) • Forecast model: COAMPS • Resolution: 30 km horizontal grid spacing, 30 vertical levels • Experiments: • CNTRL – Control forecast using COAPS analysis • ETB – with SSM/I observations and a non-diagonal B • ETBN – with SSM/I observations and a diagonal B
qc qi Height (km) qs qr Background Error Covariance Shown as a correlation matrix and a profile of standard deviation Height (km) qg Height (km) Hydrometeor std. (g/kg)) Height (km)