Download
1 / 24
240 likes | 365 Vues
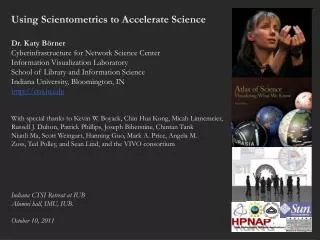
Using Scientometrics to Accelerate Science Dr. Katy Börner Cyberinfrastructure for Network Science Center Information Visualization Laboratory School of Library and Information Science Indiana University, Bloomington, IN http://cns.iu.edu

E N D
Using Scientometrics to Accelerate Science Dr. Katy Börner Cyberinfrastructure for Network Science Center Information Visualization Laboratory School of Library and Information Science Indiana University, Bloomington, IN http://cns.iu.edu With special thanks to Kevin W. Boyack, Chin Hua Kong, Micah Linnemeier, Russell J. Duhon, Patrick Phillips, Joseph Biberstine, Chintan Tank Nianli Ma, Scott Weingart, HanningGuo, Mark A. Price, Angela M. Zoss, Ted Polley, and Sean Lind, and the VIVO consortium Indiana CTSI Retreat at IUB Alumni hall, IMU, IUB. October 10, 2011
Find your way Black Box Find collaborators, friends Take terra bytes of data Identify trends 2
Scholarly Database: 25 million scholarly records http://sdb.slis.indiana.edu VIVO Research Networking http://vivoweb.org Information Visualization Cyberinfrastructure http://iv.cns.iu.edu Network Workbench Tool & Community Wiki http://nwb.cns.iu.edu Science of Science (Sci2) Tool http://sci2.cns.iu.edu Epidemics Tool & Marketplace Forthcoming Computational Scientometrics Cyberinfrastructures 3
VIVO: A Semantic Approach to Creating a National Network of Researchers (http://vivoweb.org) • Semantic web application and ontology editor originally developed at Cornell U. • Integrates research and scholarship info from systems of record across institution(s). • Facilitates research discovery and cross-disciplinary collaboration. • Simplify reporting tasks, e.g., generate biosketch, department report. Funded by $12 million NIH award. Cornell University: Dean Krafft (Cornell PI), Manolo Bevia, Jim Blake, Nick Cappadona, Brian Caruso, Jon Corson-Rikert, Elly Cramer, Medha Devare, John Fereira, Brian Lowe, Stella Mitchell, Holly Mistlebauer, Anup Sawant, Christopher Westling, Rebecca Younes. University of Florida: Mike Conlon (VIVO and UF PI), Cecilia Botero, Kerry Britt, Erin Brooks, Amy Buhler, Ellie Bushhousen, Chris Case, Valrie Davis, Nita Ferree, Chris Haines, Rae Jesano, Margeaux Johnson, Sara Kreinest, Yang Li, Paula Markes, Sara Russell Gonzalez, Alexander Rockwell, Nancy Schaefer, Michele R. Tennant, George Hack, Chris Barnes, Narayan Raum, Brenda Stevens, Alicia Turner, Stephen Williams. Indiana University: Katy Borner (IU PI), William Barnett,Shanshan Chen, Ying Ding, Russell Duhon, Jon Dunn, Micah Linnemeier, Nianli Ma, Robert McDonald, Barbara Ann O'Leary,Mark Price, Yuyin Sun, Alan Walsh, Brian Wheeler, Angela Zoss.Ponce School of Medicine: Richard Noel (Ponce PI), Ricardo Espada, Damaris Torres.The Scripps Research Institute: Gerald Joyce (Scripps PI), Greg Dunlap, Catherine Dunn, Brant Kelley, Paula King,Angela Murrell, Barbara Noble, Cary Thomas, Michaeleen Trimarchi.Washington University, St. Louis: Rakesh Nagarajan (WUSTL PI), Kristi L. Holmes, Sunita B. Koul, Leslie D. McIntosh.Weill Cornell Medical College: Curtis Cole (Weill PI), Paul Albert, Victor Brodsky, Adam Cheriff, Oscar Cruz, Dan Dickinson, Chris Huang, Itay Klaz, Peter Michelini, Grace Migliorisi, John Ruffing, Jason Specland, Tru Tran, Jesse Turner, Vinay Varughese. 4
Temporal Analysis (When) Temporal visualizations of the number of papers/funding award at the institution, school, department, and people level 6
Topical Analysis (What) Science map overlays will show where a person, department, or university publishes most in the world of science. (in work) 7
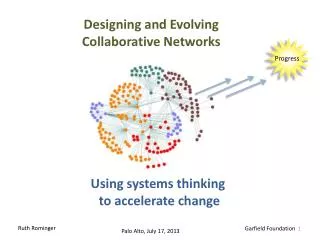
Network Analysis (With Whom?) Who is co-authoring, co-investigating, co-inventing with whom? What teams are most productive in what projects? 8
http://nrn.cns.iu.edu Geospatial Analysis (Where) Where is what science performed by whom? Science is global and needs to be studied globally. 9
Overview, Interactivity, Details on Demand come to commonly used devices and environments VIVO On-The-Go 10
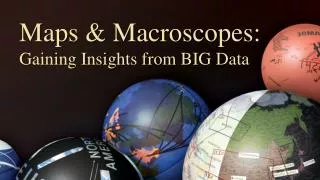
Börner, Katy. (March 2011). Plug-and-Play Macroscopes. Communications of the ACM, 54(3), 60-69. Video and paper are at http://www.scivee.tv/node/27704 12
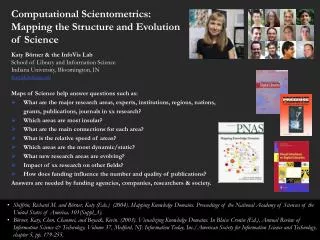
References Börner, Katy, Chen, Chaomei, and Boyack, Kevin. (2003). Visualizing Knowledge Domains. In Blaise Cronin (Ed.), ARIST, Medford, NJ: Information Today, Volume 37, Chapter 5, pp. 179-255. http://ivl.slis.indiana.edu/km/pub/2003-borner-arist.pdf Shiffrin, Richard M. and Börner, Katy (Eds.) (2004). Mapping Knowledge Domains. Proceedings of the National Academy of Sciences of the United States of America, 101(Suppl_1). http://www.pnas.org/content/vol101/suppl_1/ Börner, Katy, Sanyal, Soma and Vespignani, Alessandro (2007). Network Science. In Blaise Cronin (Ed.), ARIST, Information Today, Inc., Volume 41, Chapter 12, pp. 537-607. http://ivl.slis.indiana.edu/km/pub/2007-borner-arist.pdf Börner, Katy (2010) Atlas of Science. MIT Press. http://scimaps.org/atlas Scharnhorst, Andrea, Börner, Katy, van den Besselaar, Peter (2011) Models of Science Dynamics. Springer Verlag. 18
Debut of 5th Iteration of Mapping Science Exhibit at MEDIA X was on May 18, 2009 at Wallenberg Hall, Stanford University, http://mediax.stanford.edu, http://scaleindependentthought.typepad.com/photos/scimaps 19
Science Maps in “Expedition Zukunft” science train visiting 62 cities in 7 months 12 coaches, 300 m long Opening was on April 23rd, 2009 by German Chancellor Merkel http://www.expedition-zukunft.de 20
CTSI Accelerating Science Core The core provides consulting, data mining, and visualization of information on the current practice of science to accelerate science and competitive research using a network science and science mapping approach. Findings from theory-based research on the formation of productive teams, the identification of trends and emerging ideas, and the effective communication of complex results to diverse stakeholders are used to optimize science itself. The Accelerating Science Core provides integrative analyses of relationships in support of institutes, programs, and projects, interested to accelerate the translation of scientific results to the improvement of human health. 21
Accelerating Science Core—Services Offered Evaluation & Monitoring:Impact and/or strength analysis for a lab, center (e.g., NSF STCs or NIH CTSAs), institution, or region in order to evaluate, plan, or implement research efforts. Relevant data must be provided. $2000-$6000* Data Compilation: The construction of a custom data set (e.g., all papers, patents, grants for a certain institution or area of research) using the Scholarly Database (http://sdb.cns.iu.edu). $3000* Visual Interface to Community Data: Setting up an online interactive interface similar to http://mapsustain.cns.iu.edu (relevant data must be provided to the Core). $6000* 22
Accelerating Science Core—Services Offered VIVO Researcher Networking: Design and implementation of interactive custom VIVO visualizations (see http://vivoweb.org for more info on VIVO and http://vivo.iu.edu/vis/map-of-science/BL-ARSC for a map of science visualization). $5000* Training and Consulting in Data Mining and Visualization: Introduction of advanced data mining and visualization tools: 2-hour tutorials or 4-hour tutorials that also feature exemplary analyses of client data. See http://sci2.cns.iu.edu/user/documentation.php for sample slides. $2000-$5000* *Prices vary according to scope of work. Please contact us to request an estimate. 23
All papers, maps, tools, talks, press are linked from http://cns.iu.edu CNS Facebook: http://www.facebook.com/cnscenter Mapping Science Exhibit Facebook: http://www.facebook.com/mappingscience 24