Challenges and Techniques in Graph Visualization: Insights from Yang Zhang and Dave Fuhry
This survey presents key challenges in graph visualization, addressing issues such as graph layout, rendering at scale, and high computational costs. It explores force-directed layout algorithms, interactive techniques, and methods for visualizing cohesive subgraphs. Examples include pseudo-code for simulation setups and practical applications of various web-based tools like Gephi and Sigma.js. The survey also covers hierarchical clustering and dynamic graphs, providing a comprehensive overview for researchers and practitioners in the field of graph visualization.


Challenges and Techniques in Graph Visualization: Insights from Yang Zhang and Dave Fuhry
E N D
Presentation Transcript
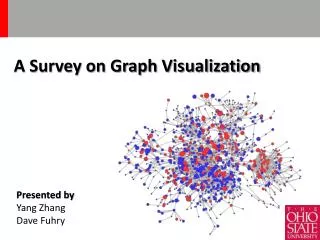
A Survey on Graph Visualization Presented by Yang Zhang Dave Fuhry
Challenges • Graph Layout • Make a concrete rendering of graph. • Scale for large graphs • Render on a computer screenwith limited pixels • High computational cost • Interaction • Show more detail for area of interest • Exploration for intuition
Force-Directed Layout • Nodes are modeled as physical bodies that are connected through springs (edges) • Pseudo code • Example • High running time • The typical force-directed algorithms are in general considered to have a running time equivalent to O(n3) , where n is the number of nodes of the input graph.
Pseudo Code set up initial node positions randomly loop total_kinetic_energy := 0 for each node net-force := (0, 0) for each other node net-force := net-force + repulsion( this_node, other_node ) for each spring connected to this node net-force := net-force + attraction( this_node, spring ) // without damping, it moves forever this_node.velocity := (this_node.velocity + timestep * net- force) * damping this_node.position := this_node.position + timestep * this_node.velocity total_kinetic_energy := total_kinetic_energy + this_node.mass *(this_node.velocity)^2 until total_kinetic_energy is less than some small number // the simulation has stopped moving
Zoom and pan • Zoom for graphs exact, adjustment of screen transformations • The internet map: http://internet-map.net/
Hierarchical Clustering • Successively applying the clustering process to clusters discovered by a previous step. • Can be navigated as tree
Dynamic Graphs Events in dynamic graphs
Visualizing Cohesive Subgraphs • cohesive subgraphs • A subgraph in which vertices are densely connected. • Clique, K-Core, etc. • CSV • For each edge e, compute c(e), which is the size of the biggest clique that contains e. • Plot each vertex in the following order: • Randomly pick up the first vertex to plot; • Pick up the next vertex which shares an edge with maximum c(e) with previously plotted vertices. Plot the vertex with height = c(e) • The peaks indicate dense cohesive subgraphs
Directed K-Core : D-core • D = (V;E) is a digraph that is a set V of vertices and a set E of directed edges between them. • The min-in-degree and the min-out-degree of a digraph D are defined as • a (k; l)-D-core of D is a maximal sub-digraph F of D where • Denoted as
D-core matrix • For directed graph D, there is a unique (k; l)-D-core for each (k; l). We define D-core matrix AD as follows: AD(k; l) = size of (k; l)-D-core.
Tools Web-based tools • Cobweb: http://bioinformatics.charite.de/cobweb/ • Sigma.js: http://sigmajs.org/ • InfoVis: http://thejit.org/ • Cytoscape web: http://cytoscapeweb.cytoscape.org/ Applications • Gephi: http://gephi.org/ • Cytoscape: http://www.cytoscape.org/ • Guess: http://graphexploration.cond.org/index.html