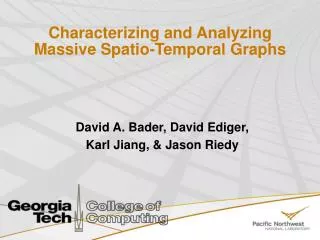
Massive Graph Visualization: LDRD Final Report
Massive Graph Visualization: LDRD Final Report. Sandia National Laboratories Sand 2007-6307 Printed October 2007. Abstract. Background: Sandia Labs (New Mexico and California) was established in 1949 to find science based engineering solutions to national security problems.

Massive Graph Visualization: LDRD Final Report
E N D
Presentation Transcript
Massive Graph Visualization: LDRD Final Report Sandia National Laboratories Sand 2007-6307 Printed October 2007
Abstract Background: Sandia Labs (New Mexico and California) was established in 1949 to find science based engineering solutions to national security problems. The project purpose is to develop visualization technologies that will enable visualization of massive graphs for use in homeland security. “There are many techniques for visualizing medium to large size graphs, there is a void in research for visualizing massive graphs. Sandia is one of the few places in the world that has the means and motivation to handle data on such a massive scale”
Identified two major gaps that need to be addressed: • First, developing a framework for parallel interactive processing of massive graph data. • Second, developing scalable algorithms so that the framework can be used. Sandia already has in place a large network of distributed parallel computers so this project focus was on parallel algorithms that can be integrated with the applications already available at the Laboratory and leveraged with previous work and platforms.
Framework The Sandia framework for visualization is the VTK, the Visualization Toolkit. It is set up for scientific visualization where the data types have a connection to physical space. Part of the project was to use this technology to handle information visualization where the data has no connection to physical space, i.e. homeland security data that deals with text, entities, etc.
Databases • Designed databases specifically for graph storage and retrieval • Then read the data from the database for parallel processing • Queries are saved and then partitions of the table are streamed to each processing element. • The tables are converted into partitioned graphs through identification of vertices and edges.
Data Structures • Used to work of Yoo et al. (see Citations) to implement graph partitioning: • Vertex Partitioning – divide the vertices up among the processes and assign the edges based on the processes that hold the vertices. The disadvantage here for parallel processing is that the vertices point to vertices in all other processes meaning that the communication requirements between processes are all-to-all. This introduces a great deal of overhead. • Edge Partitioning – divides up the edges rather than vertices between processes resulting in partial adjacency matrix in each process. The advantage is that any edge in the graph can be followed by moving along the row or column.
1-D Partitioning (from Yoo, et. Al.)“A 1-D partitioning of a graph is a partitioning of its vertices such that each vertex andthe edges emanating from it are owned by one processor.”
1-D Partitioning (from Yoo, et. al.) “A 2-D (checkerboard) partitioning of a graph is a partitioning of its edges such that each edge is owned by one processor. In addition, the vertices are also partitioned such that each vertex is owned by one processor, like in 1-D partitioning. A process stores some edges incident on its owned vertices, and some edges that are not.”
Algorithms • Use of Force Directed layout algorithms to impose spatial coordinates on the graph elements. • Fast Layout: the force field is computed on a finite mesh. • G-Space layout: Pick two vertices at random, perform a breadth-first search on each that calculates the distance of all other vertices to these two. • Rendering and Viewing: massive images become saturated. So fragments are aggregated to show collections. This works for vertices but not edges. • Edge Algorithm: developed a process that accumulates the edges based on position and orientation to see how they bundle together. • Landscape: based on the density of the vertices create a carpet plot with peaks and valleys and then used metadata to label the areas.
Parallel Graph Visualization Framework • Adjacency List: (from the Titan project) each vertex in an array that points to the other vertices to which it connects. This can be very compact if the average vertex degree is much lower than the total number in the graph. • Edge Partitioning: Stores the edge data rather than the vertex data. The advantage is that edges can be followed through the table rows and columns. • Reading and Querying: only able to read in parallel using database information. At this point in time (2007) no file formats that can hold massive graph information and have it read in efficiently for parallel processing. The advantage is that the database provides querying capability.
Fast Layout • Force Directed: The repulsive forces are modeled as a vector field rather than calculating the forces individually for each vertex. It samples the field and computes is everywhere using splatting. • Splatting: It calculates a kernel, the image of a single vertex’s impact on the vector field. Then splatting this kernel on the field where the vertex is located and then accumulating splats. • Fast Splatting: simplifies splatting with a single impulse for each vertex, then counting and convolving the impulses. This results in a significantly faster algorithm.
G-Space • LDE: Low Dimensional Embedding – uses two vertices as pivot points and using breadth first search finds the shortest path distance from each pivot point to each vertex resulting in paired data. The data is used to map each vertex in a 2-D space. Then geometric properties can be used to explore the layout. • Vertex Bundling: grouping them together based on similar connectivity. The vertices can then be divided into few or many bins to split them and determine relationships.
Edge Accumulation • Edge Frequencies: using line segment overlap with length, location, and angle, edges with similar placement can be bundled together. Parameterization of the line segment is done using its centroid, length, and orientation. Use of the centroid reduces the number of comparisons necessary. • Sweep Line: This algorithm sweeps across the graph and collects an active line segment list of similar candidates and updates a frequency parameter. The data collected must be implemented in some type of search structure for easy access to draw the frequent edges.
Parallel Landscape View • Landscape View: a landscape is used as a visualization of the graph where peaks correspond to dense vertex clusters with zoom capability. It provides information about location and size of vertex clusters. • Labeling: Need to search for words in each set of vertices associated with the data and build a string for the label.
Future Work • Project Accomplishments: Successfully implemented scalable parallel framework for massive graph visualization that will run interactively. • Future: Integrate this into existing applications: ThreatView and ParaView. Create tools and expertise to perform scalable massive graph visualization.
Authors • Dr. Kenneth Moreland, SMTS Scalable Analytics & Visualization • Brian N. Wylie, PMTS Scalable Analylics & Visualization Citations Andy Yoo, Edmond Chow, Keith Henderson, William McLendon, Bruce Hendrickson, and UmitCatelyurek. A scalable distributed parallel breadth-first search algorithm on BlueGene/L. In SC ’05: Proceedings of the 2005 ACM/IEEEconference on Supercomputing, 2005. DOI=10.1109/SC.2005.4.46