Download
1 / 42
420 likes | 543 Vues
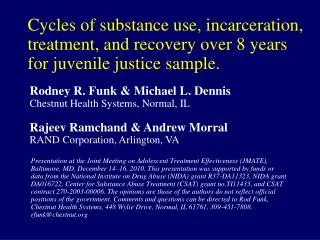
Intervening with Adolescent Substance User: What do we know so far about and where do we go from here. Michael Dennis, Ph.D. Chestnut Health Systems, Normal, IL October 29, 2009

E N D
Intervening with Adolescent Substance User:What do we know so far about and where do we go from here Michael Dennis, Ph.D. Chestnut Health Systems, Normal, IL October 29, 2009 Presentation for Washington State and Regional Policy Makers at the Puget Sound Educational School District, Renton, WA, October 27-30, 2009. This presentation was supported by PSESD, ESD113, and King County. The author would like to thank Dennis Deck for providing the tables of 2009 SAPISP data. The presentation also reports on treatment & research funded by the Center for Substance Abuse Treatment (CSAT), Substance Abuse and Mental Health Services Administration (SAMHSA) under contracts 270-2003-00006 and 270-07-0191, as well as several individual CSAT, NIAAA, NIDA and private foundation grants. The opinions are those of the author and do not reflect official positions of the consortium or government. Available on line at www.chestnut.org/LI/Posters or by contacting Michael Dennis, Chestnut Health Systems, 448 Wylie Drive, Normal, IL 61761, phone 309-451-7801, fax 309-451-7765, e-Mail: mdennis@Chestnut.Org Questions about the GAIN can also be sent to gaininfo@chestnut.org
Substance use severity is related to crime and violence Crime & Violence by Substance Severity Adolescents 12-17 Source: NSDUH 2006
..as well as family, school and mental health problems Family, Vocational & MH by Substance Severity Adolescents 12-17 Source: NSDUH 2006
People Entering Publicly Funded Treatment Generally Use For Decades It takes 27 years before half reach 1 or more years of abstinence or die 100% 90% 80% 70% 60% 50% 40% 30% 20% 10% 0% Percent still using Years from first use to 1+ years of abstinence 0 5 10 15 20 25 30 Source: Dennis et al., 2005
The Younger They Start, The Longer They Use 100% 90% 80% 70% 60% 50% 40% 30% 20% 10% 0% Percent still using Age of First Use* Years from first use to 1+ years of abstinence under 15 60% longer 15-20 21+ 0 5 10 15 20 25 30 * p<.05 Source: Dennis et al., 2005
The Sooner They Get The Treatment, The Quicker They Get To Abstinence 100% 90% 80% 70% 60% 50% 40% 30% 20% 10% 0% Years to first Treatment Admission* Percent still using 20 or more years Years from first use to 1+ years of abstinence 57% quicker 10 to 19 years 0 to 9 years 0 5 10 15 20 25 30 • p<.05 Source: Dennis et al., 2005
After Initial Treatment… • Relapse is common, particularly for those who: • Are Younger • Have already been to treatment multiple times • Have more mental health issues or pain • It takes an average of 3 to 4 treatment admissions over 9 years before half reach a year of abstinence • Yet over 2/3rds do eventually abstain • Treatment predicts who starts abstinence • Self help engagement predicts who stays abstinent Source: Dennis et al., 2005, Scott et al 2005
86% 66% 36% After 4 years of abstinence, about 86% will make it another year The Likelihood of Sustaining Abstinence Another Year Grows Over Time After 1 to 3 years of abstinence, 2/3rds will make it another year 100% . Only a third of people with 1 to 12 months of abstinence will sustain it another year 90% 80% 70% 60% % Sustaining Abstinence Another Year 50% 40% 30% 20% 10% 0% 1 to 12 months 1 to 3 years 4 to 7 years But even after 7 years of abstinence, about 14% relapse each year Duration of Abstinence Source: Dennis, Foss & Scott (2007)
The Cyclical Course of Relapse, Incarceration, Treatment and Recovery: Adolescents • Probability of Going to Using vs. Early “Recovery” (+ good) • - Baseline Substance Use Severity (0.74) + Baseline Total Symptom Count (1.46) • - Past Month Substance Problems (0.48) + Times Urine Screened (1.56) • - Substance Frequency (0.48) + Recovery Environment (r)* (1.47) • + Positive Social Peers (r)** (1.69) In the In Recovery Community (62% stable) Using (75% stable) 26% 19% • * Average days during transition period of participation in self help, AOD free structured activities and inverse of AOD involved activities, violence, victimization, homelessness, fighting at home, alcohol or drug use by others in home • ** Proportion of social peers during transition period in school/work, treatment, recovery, and inverse of those using alcohol, drugs, fighting, or involved in illegal activity. In Treatment (48 v 35% stable) Source: 2006 CSAT AT data set
The Cyclical Course of Relapse, Incarceration, Treatment and Recovery: Adolescents Probability of Going to Using vs. Early “Recovery” (+ good) + Recovery Environment (r)* (3.33) Incarcerated (46% stable) 10% 20% In the In Recovery Community (62% stable) Using (75% stable) * Average days during transition period of participation in self help, AOD free structured activities and inverse of AOD involved activities, violence, victimization, homelessness, fighting at home, alcohol or drug use by others in home Source: 2006 CSAT AT data set
Recovery* by Level of Care 100% Outpatient (+79%, -1%) 90% Residential(+143%, +17%) 80% Post Corr/Res (+220%, +18%) 70% CC better 60% Percent in Past Month Recovery* 50% OP & Resid Similar 40% 30% 20% 10% 0% Pre-Intake Mon 1-3 Mon 4-6 Mon 7-9 Mon 10-12 * Recovery defined as no past month use, abuse, or dependence symptoms while living in the community. Percentages in parentheses are the treatment outcome (intake to 12 month change) and the stability of the outcomes (3months to 12 month change) Source: CSAT Adolescent Treatment Outcome Data Set (n-9,276)
Cost of Substance Abuse Treatment Episode • $750 per night in Detox • $1,115 per night in hospital • $13,000 per week in intensive • care for premature baby • $27,000 per robbery • $67,000 per assault $70,000/year to keep a child in detention $22,000 / year to incarcerate an adult $30,000/ child-year in foster care Source: French et al., 2008; Chandler et al., 2009; Capriccioso, 2004
Investing in Treatment has a Positive Annual Return on Investment (ROI) • Substance abuse treatment has been shown to have a ROI of between $1.28 to $7.26 per dollar invested • Even year long treatment drug courts have an average ROI of $2.14 to $2.71 per dollar invested This also means that for every dollar treatment is cut, we lose more money than we saved. Source: Bhati et al., (2008); Ettner et al., (2006)
Washington Youth Served by Treatment & SAP are already costing society • Using the GAIN we are able estimate the cost to society of tangible services (e.g., health care utilization, days in detention, probation, parole, days of missed school) in 2009 dollars for the 90 days before intake • The 258 adolescents served by ESD113 in the 2008-9 school year… • cost society $229,830 ($919.322 per year) • an average of $891 per adolescent ($3,663 per year) • The 2,733 adolescents served in King County between 2005-2009… • cost society $4,609,580 ($18.438,321 per year) • an average of $1,687 per adolescent ($6,747 per year) • Thus both are targeting groups with a high potential to offset their costs to society (or cost you more if you cut back on them)
Few Get Treatment: 1 in 17 adolescents, 1 in 22 young adults, 1 in 12 adults Substance Use Disorders are Common,But Treatment Participation Rates Are Low:United States (US) Over 88% of adolescent and young adult treatment and over 50% of adult treatment is publicly funded Much of the private funding is limited to 30 days or less and authorized day by day or week by week Source: OAS, 2006 – 2003, 2004, and 2005 NSDUH
Substance Use Disorders are Common,But Treatment Participation Rates Are Low:Washington State Higher problem rate for young adults, but higher treatment rate : 1 in 7 Similar rates for adolescents : 1 in 18 Higher problems rate, and less treatment participation for adults: 1 in 19 Source: OAS, 2006 – 2003, 2004, and 2005 NSDUH
Substance Use Disorders are Common,But Treatment Participation Rates Are Low:Seattle & King County, WA High higher problems rate, but similar treatment rates: 1 in 19 young adults 1 in 12 adults Similar problem rate but much lower Treatment Rate: 1 in 40 adolescents Source: OAS, 2006 – 2003, 2004, and 2005 NSDUH
Adolescent Rates of High (2+) Scores on Mental Health (MH) or Substance Abuse (SA) Screener by Setting in Washington State Problems could be easily identified Comorbidity is common Source: Lucenko et al (2009). Report to the Legislature: Co-Occurring Disorders Among DSHS Clients. Olympia, WA: Department of Social and Health Services. Retrieved from http://publications.rda.dshs.wa.gov/1392/
Where in the System are the Adolescents with Mental Health, Substance Abuse and Co-ocurring? Source: Lucenko et al (2009). Report to the Legislature: Co-Occurring Disorders Among DSHS Clients. Olympia, WA: Department of Social and Health Services. Retrieved from http://publications.rda.dshs.wa.gov/1392/
Where in the System are the Adolescents with Mental Health, Substance Abuse and Co-ocurring? <1% <1% <1% Source: Lucenko et al (2009). Report to the Legislature: Co-Occurring Disorders Among DSHS Clients. Olympia, WA: Department of Social and Health Services. Retrieved from http://publications.rda.dshs.wa.gov/1392/
Adolescent Client Validation of Hi Co-occurring from GAIN Short Screener vs Clinical Records by Setting in Washington State Two page measure closely approximated all found in the clinical record after the next two years Source: Lucenko et al (2009). Report to the Legislature: Co-Occurring Disorders Among DSHS Clients. Olympia, WA: Department of Social and Health Services. Retrieved from http://publications.rda.dshs.wa.gov/1392/
Track Gap Between Prior and current Lifetime Problems to identify “under reporting” Track progress in reducing current (past month) symptoms) GAIN SS Can Also be Used for Monitoring 20 12+ Mon.s ago (#1s) 2-12 Mon.s ago (#2s) 16 Past Month (#3s) Lifetime (#1,2,or 3) 11 12 10 10 9 9 8 8 3 4 2 2 0 Intake 3 6 9 12 15 18 21 24 Mon Mon Mon Mon Mon Mon Mon Mon Total Disorder Screener (TDScr) Monitor for Relapse
SAPISP Results: State Wide (n=10,924) GAIN SS uses triage: 0=Low 1-2=Mod 3+=High WA State dichotomizes as 0-1=Low 2+=High Source: SAPISP 2009 Data
Total Disorder Screener Severity by Level of Care About 30% of OP & SAP are in the high severity range more typical of residential Outpatient & Student Asst. Prog. are Similar (Median 6.0 vs. 6.4) Residential Median (10.5) is higher Well Targeted 95% 1+ 85% 3+ Source: SAPISP 2009 Data and Dennis et al 2006 24
Internalizing Disorder Screener by Level of Care SAP Higher on Internalizing Disorders Source: SAPISP 2009 Data and CSAT 2008 Full subset to Adolescent Intakes
Externalizing Disorder Screener by Level of Care SAP Mod-Hi on Externalizing Disorders Source: SAPISP 2009 Data and CSAT 2008 Full subset to Adolescent Intakes
Substance Disorder Screener by Level of Care SAP Lower on Substance Disorders Source: SAPISP 2009 Data and CSAT 2008 Full subset to Adolescent Intakes
Crime/Violence Screener by Level of Care SAP Lower on Crime/Violence Source: SAPISP 2009 Data and CSAT 2008 Full subset to Adolescent Intakes
King County: Pattern of Weekly Use Source: King County 08/31/09 (n=3102) 29
King County: Substance Use Disorder Severity Source: King County 08/31/09 (n=3102) 30
King County: Co-Occurring Psychiatric Problems Externalizing Disorders Internalizing Disorders Source: King County 08/31/09 (n=3102) 31
King County: Recovery Environment Source: King County 08/31/09 (n=3102) 32
King County: Past Year Violence & Crime *Dealing, manufacturing, prostitution, gambling (does not include simple possession or use) Source: King County 08/31/09 (n=3102) 33
King County: Intensity of Juvenile Justice System Involvement Source: King County 08/31/09 (n=3102) 34
King County: Count Number of Problems Mod/Hi* Over 90% self report one or more major clinical problems Over half report 5 or more major clinical problems * (Alcohol, cannabis, or other drug disorder, depression, anxiety, trauma, suicide, ADHD, CD, victimization, violence/ illegal activity) Source: King County 08/31/09 (n=3102) 35
So what does it mean to move the field towards Evidence Based Practice (EBP)? • Introducing explicit intervention protocols that are • Targeted at specific problems/subgroups and outcomes • Having explicit quality assurance procedures to cause adherence at the individual level and implementation at the program level • Having the ability to evaluate performance and outcomes • For the same program over time, • Relative to other interventions • Introducing reliable and valid assessment that can be used • At the individual level to immediately guide clinical judgments about diagnosis/severity, placement, treatment planning, and the response to treatment • At the program level to drive program evaluation, needs assessment, performance monitoring and long term program planning
Major Predictors of Bigger Effects • Chose a strong intervention protocol based on prior evidence • Used quality assurance to ensure protocol adherence and project implementation • Used proactive case supervision of individual • Used triage to focus on the highest severity subgroup
Impact of the numbers of Favorable features on Recidivism (509 JJ studies) Recidivism Drops the more factors present Average Practice Source: Adapted from Lipsey, 1997, 2005
Exploring Need, Unmet Need, & Targeting of Mental Health Services in AAFT 218/224=97% to targeted 553/771=72% unmet need 771/982=79% in need Size of the Problem Extent to which services are not reaching those in most need Extent to which services are currently being targeted
Mental Health Problem (at intake) vs. Any MH Treatment by 3 months *3+ on ASAM dimension B3 criteria Source: 2008 CSAT AAFT Summary Analytic Dataset
Why Do We Care About Unmet Need? • If we subset to those in need, getting mental health services predicts reduced mental health problems • Both psychosocial and medication interventions are associated with reduced problems • If we subset to those NOT in need, getting mental health services does NOT predict change in mental health problems Conversely, we also care about services being poorly targeted to those in need.
Residential Treatment need (at intake) vs. 7+ Residential days at 3 months Opportunity to redirect existing funds through better targeting Source: 2008 CSAT AAFT Summary Analytic Dataset