Graphing Lines
This guide explores the concepts of slope and y-intercept in graphing linear equations. It covers essential techniques for finding x and y intercepts, including solving for values when y=0 and x=0. Using examples such as the equation for train car capacity (3x + 2y = 120), we will demonstrate how to identify intercepts and their meanings in real-world contexts. Furthermore, the domain and range of the function will be discussed. Mastering these concepts is crucial for analyzing and interpreting linear relationships.

Graphing Lines
E N D
Presentation Transcript
Graphing Lines slope & y-intercept & x- & y- intercepts
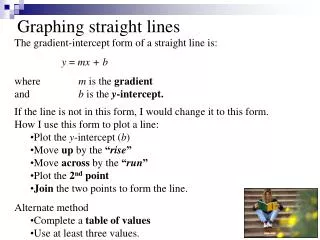
slope and y-intercept Graphing Lines
Run 3 y-intercept b = -1 Rise 2 slope
Run 2 y-intercept Rise b = 3 -1 slope
x- and y- intercepts Graphing Lines
3x - 2y = 7 find the x value when y = 0 x-intercept 3x - 2(0)= 7 3x - 0= 7 3x= 7 find the y value when x = 0 y-intercept 3(0) - 2y= 7 0 - 2y= 7 -2y= 7
The equation 3x +2y = 120 models the number of passengers who can sit in a train car, where x is the number of adults and y is the number of children. Graph the equation.
3x + 2y = 120 find the x value when y = 0 x-intercept 3x + 2(0)= 120 3x + 0= 120 3x= 120 find the y value when x = 0 y-intercept 3(0) + 2y= 120 0 + 2y= 120 2y= 120
What is the domain and range of the function? Domain: Range: What do the x & y intercepts represent in relation to the problem?