Easy Graphing of Linear Equations in Slope-Intercept Form
Learn how to graph linear equations using slope-intercept form with step-by-step instructions and examples. Practice identifying slope and y-intercept. Convert equations to slope-intercept form effortlessly. Improve graphing skills.


Easy Graphing of Linear Equations in Slope-Intercept Form
E N D
Presentation Transcript
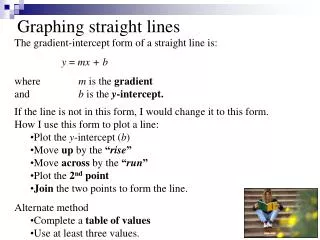
Graphing lines using the equation • Identify the Y-intercept (b) and graph it on the y-axis with a point. • Identify what the slope is (m). Remember slope is rise over run. • From the point on the y-axis, if your slope is positive go up or if it is negative go down whatever the RISE is. Go over to the right for the run. Mark the spot with a point. • Draw a line thru those two points
Y= 2/3 x + 3 • Go to the y-axis and draw a point at 3. • From that point go up 2 units and over 3 units. Draw a point. • Draw a line thru those two points. • That is how easy it is to graph lines.
Y = -3x -1 • Go to the y-axis and draw a point at –1. • From that point go down 3 units and over 1. Draw a point. • Draw a line thru those points. • Wow that was easy!
Y= 2 • Draw out a two column box. The first column is labeled X and the second column is labeled Y. • Fill the Y column with values of 2 because the equation said so. • Pick any values for x. • Now graph those ordered pairs and draw a line thru those points.
X= -4 • Make a chart again like last time. • But, All the values for x are –4’s. Because our equation said so. • You decide the values for the y’s. • Now graph the ordered pairs and draw a line thru those points.
Practice converting linear equations into Slope-Intercept Form It’s easier than you think…
Slope intercept form is: y = mx + b Our main goal is to get the y alone on one side of the equation
Convert Into Slope-Intercept Form (divide both sides by 2 to get y alone) (now simplify all fractions) 2 1
Intercept slope Now look at the equation below…… When an equation is in slope-intercept form: y = mx + b 2 What is the slope? ____________ 1 What is the intercept? ____________
Now look at the graph of the line. y = 2x + 1 Step 1: Look at the y-intercept and plot where the graphs cross the “y” axis. Step 2: Use the slope (rise/run) to determine the next point and plot. Step 3: Draw a line through both points. Be sure to extend pass point and put arrow at both ends.
*** Easy *** Convert to Slope-Intercept Form: 5y = 10x + 15 (divide both sides by 5 to get y alone) (now simplify all fractions) y = 2x + 3 BRAVO!!
*** Now Try this Convert to Slope-Intercept Form*** -3y = -9x - 12 Step 1: divide both sides by -3 to get y alone Step 2: Simplify all fractions Step 3: Write your equation in y = mx + b What is the slope? ____________ What is the intercept? ____________
-3-3 -3y = -9x - 12 -3-3 -3 *** Check Your Answer *** -3y = -9x - 12 (divide both sides by -3 to get y alone) (now simplify all fractions) y = 3x + 4 Wow, you’re good at this!! Slope = 3 Intercept = 4
*** medium *** Convert to Slope-Intercept Form: 21x – 7y =14 (subtract both sides by 21x) (now divide both sides by -7) -7y = -21x + 14 (simplify all fractions) y = 3x – 2
*** Now Try this Convert to Slope-Intercept Form*** 2y + 26 = -6x Step 1: Subtract both sides by 26 Step 2: Divide both sides by 2 to get y by itself Step 3: Simplify all fractions What is the slope? ____________ What is the intercept? ____________
*** Check Your Answer*** 2y + 26 = -6x (subtract both sides by 26) (now divide both sides by 2 2y = -6x - 26 (simplify all fractions) y = -3x - 13 You are a math wizard!
Graphing Linear Equations In Slope-Intercept Form
We have already seen that linear equations have two variables and when we plot all the (x,y) pairs that make the equation true we get a line. In this section, instead of making a table, evaluating y for each x, plotting the points and making a line, we will use The Slope-Intercept Form of the equation to graph the line.
These equations are all in Slope-Intercept Form: Notice that these equations are all solved for y.
Just by looking at an equation in this form, we can draw the line (no tables). • The constant is the y-intercept. • The coefficient is the slope. Constant = 1, y-intercept = 1. Coefficient = 2, slope = 2. Constant = -4, y-intercept = -4. Coefficient = -1, slope = -1. Constant = -2, y-intercept = -2. Coefficient = 3/2, slope = 3/2.
The formula for Slope-Intercept Form is: • ‘b’ is the y-intercept. • ‘m’ is the slope. On the next three slides we will graph the three equations: using their y-intercepts and slopes.
right 1 up 2 right 1 up 2 1) Plot the y-intercept as a point on the y-axis. The constant, b = 1, so the y-intercept = 1. 2) Plot more points by counting the slope up the numerator (down if negative) and right the denominator. The coefficient, m = 2, so the slope = 2/1.
down 1 down 1 right 1 right 1 1) Plot the y-intercept as a point on the y-axis. The constant, b = -4, so the y-intercept = -4. 2) Plot more points by counting the slope up the numerator (down if negative) and right the denominator. The coefficient, m = -1, so the slope = -1/1.
right 2 up 3 right 2 up 3 1) Plot the y-intercept as a point on the y-axis. The constant, b = -2, so the y-intercept = -2. 2) Plot more points by counting the slope up the numerator (down if negative) and right the denominator. The coefficient, m = 3/2, so the slope = 3/2.
Sometimes we must solve the equation for y before we can graph it. The constant, b = 3 is the y-intercept. The coefficient, m = -2 is the slope.
down 2 down 2 right 1 right 1 1) Plot the y-intercept as a point on the y-axis. The constant, b = 3, so the y-intercept = 3. 2) Plot more points by counting the slope up the numerator (down if negative) and right the denominator. The coefficient, m = -2, so the slope = -2/1.