Download
1 / 27
270 likes | 372 Vues
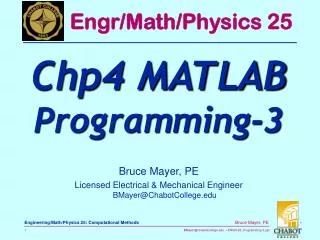
Engr/Math/Physics 25. Chp4 MATLAB Programming-3. Bruce Mayer, PE Licensed Electrical & Mechanical Engineer BMayer@ChabotCollege.edu. Learning Goals. Write MATLAB Programs That can MAKE “Logical” Decisions that Affect Program Output Write Programs that Employ LOOPing Processes

E N D
Engr/Math/Physics 25 Chp4 MATLABProgramming-3 Bruce Mayer, PE Licensed Electrical & Mechanical EngineerBMayer@ChabotCollege.edu
Learning Goals • Write MATLAB Programs That can MAKE “Logical” Decisions that Affect Program Output • Write Programs that Employ LOOPing Processes • For→ No. Loops know a priori • while → Loop Terminates based on Logic Criteria
The if Statement Basic Form iflogical expression statements end Every if statement must have an accompanying endstatement. The end statement marks the terminous of the statements that are to be executed if the logical expression is true. if Decision Statement Start if LogicalExpression False True Statements end Statements
else Statement Basic Form iflogical expression Statement Group-1 else Statement Group-2 end else Decision Statement Start if LogicalExpression False True Statements-1 Statements-2 end Statements
When the test, if logical expression, is performed, where the logical expression may be an ARRAY, the test returns a value of true only if ALL the elements of the logical expression evaluated as true “Logic Gate” equivalent statement (“and”) ALL High → Output High ELSE Output Low Logical Expression on Arrays
For example, if we fail to recognize how the test works, the following statements may not perform as expected Logical Array Example x = [4,-9,25]; if x < 0 disp(’Some elements of x are negative.’) else y = sqrt(x) end • Because the test if x < 0 is false, when this program is run it gives the result y = 2.0000 0 + 3.0000i 5.0000
Now Fine-Tune to Test for Positivex Logical Array Example cont x = [4,-9,25]; if x >= 0 y = sqrt(x) else disp('Some elements of x are negative.') end ENTIRE Statement is FALSE since ONE element is False • This File Produces Only the Message Some elements of x are negative. • The test if x < 0 is false, and the test if x >= 0 also returns a false value because x >= 0 returns the vector [1,0,1].
The following statements Combine Decisions & Logicals if logical expression 1 if logical expression 2 statements end end • Can be written more Concisely with if logical expression 1 & logical expression 2 statements end
The Code Example: Decisions & Logicals • The OutPut t = 2.8904 q = 2.8904 r = 7; s = -11; % Double if if r < 13 if s > -17 t = log(abs(r)+abs(s)) end end % if-n-& if (r < 13)&(s > -17) q = log(abs(r)+abs(s)) end
The elseif Statement Basic Form if logical expression 1 statement group 1 elseiflogical expression 2 statement group 2 else statement group 3 end The elseif Statement • The else statement must come AFTER the elseif statement to since the else yields the DEFAULT result Default
elseif FlowChart Start if LogicalExpression elseifLogical Expr else else True True Statements-1 Statements-2 Statements-3 end Statements
Given y = log(x) for x > 10 y = sqrt(x) for 0 <= x <= 10, y = exp(x) - 1 for x < 0 The Following finds y for given user input for x x = input('enter scalar: x = ') if x > 10; z = log(x); elseif x >= 0 z = sqrt(x); else z = exp(x) - 1; end % output to user y = z elseif Example • The InPut & OutPut x = -3.7000 y = -0.9753
Nesting if statements is a alternative to the elseif form Start Nested if FlowChart x < 13? Yes No y = 7.3x z = -19x + 29 y = sinh(x) y > 43? y 17? No No z = 0 Yes Yes z = √y z = y1.89 y, z out
A STRING is a variable that contains Characters. Strings are useful for creating input prompts & messages, and for storing & operating on data such as names and addresses To create a string variable, enclose the characters in single quotes. For example, Create string variable NYgiant: Strings >> NYgiant = 'Mel Ott' NYgiant = Mel Ott
The following string, digits, is not the same as the variable number created by typing digits = 987. Strings cont >> digits = '987' digits = 987 >> p = log(digits) ??? Function 'log' is not defined for values of class 'char'. No Indent for String
The prompt program on the next slide uses the isempty(x) function, which returns a 1 if the array x is empty and 0 otherwise The Program also uses the input function, with syntax Strings & the input Statement x = input(’prompt’, ’string’) • This function displays the string prompt on the screen, waits for input from the keyboard, and returns the entered value in the string variable x. • The function returns an empty matrix if you press the Enter key without typing anything.
The following prompt program is a script file that allows the user to answer Yes by typing either Y or y or by pressing the Enter key. Any other response is treated as the answer No. Strings and Decisions response = input('Want to continue? Y/N:','s') if (isempty(response))|(response==’Y’)|response==’y’) response = ’Y’ else response = ’N’ end Time For Live Demo
Display Str&Double on SAME Line • Use disp(X), Along with the [ ] Operator • Example Find: • Example Find >> disp(['the SqRt of "e" is ', num2str(exp(1/2), 7), '; a nice result ;-)']) the SqRt of "e" is 1.648721; a nice result ;-) >> Eto3_7_Ltrs = num2str(exp(3.7), 11) Eto3_7_Ltrs =40.44730436 >> disp(['e to 3.7 pwr = ', Eto3_7_Ltrs]) e to 3.7 pwr = 40.44730436
Given Spring-Loaded Platform Example: Prob 4-20 • In ENGR36 we Learn that the Spring Force • In This Case the ENGR36 Force-Balance Model • Where • k the “Spring Constant” in N/m • x the Compression Distance in m
Problem 4-20 cont Time For Live Demo • Find or Create • A Function to find x given W, k1, k2, and d • A Plot of x vs. W for 0 W 3000 N given • k1 = 10 kN/m = 10 N/mm • k2 = 15 kN/m = 15 N/mm • d = 100 mm • Solve Force-Balance Eqns for x
Before Brk-Pt The Prob 4-20 Plots • After Brk-Pt
All Done for Today A NiceSpringPlatform
Engr/Math/Physics 25 Appendix Time For Live Demo Bruce Mayer, PE Licensed Electrical & Mechanical EngineerBMayer@ChabotCollege.edu
Case-1 → W = 500N Prob-20 Test Session >> spring_plat(500,10e3,15e3,0.1) The Compression distance in m, x = 0.0500 • Case-2 → W = 2 kN >> spring_plat(2e3,10e3,15e3,0.1) The Compression distance in m, x = 0.1250
Documentation & Inputs .m-file = Prob4_20_plot.m % Bruce Mayer, PE * 26Sep11 % ENGR25 * Problem 4-20 % file = Prob4_20_plot.m % Plot Displacement vs. Wt for Spring Platform % % INPUT SECTION Wmax = input('Max Weight in N = '); k1 = input('Main-Spring Const in N/m = '); k2 = input('Secondary-Spring Const in N/m = '); d = input('distance to 2nd Springs in m = ');
.m-file = Prob4_20_plot.m cont %CALCULATION SECTION % calc Critical-Load for Curve Break-Point Wcrit = k1*d % Plot 3 pts for PieceWise Linear range if Wcrit <= Wmax % All 3 springs engaged W=[0, Wcrit, Wmax]; % 3element row vector % make corresponding 3-pt output vector x = [spring_plat(W(1),k1,k2,d),spring_plat(W(2),k1,k2,d),... spring_plat(W(3),k1,k2,d)]; plot(W,1000*x,'-s'), xlabel('Wt (N)'), ylabel('Compression (mm)'),... title('Above-Critical Load') % Plot 2pts for one Spring Linear Range else W = [0,Wmax] x = [spring_plat(W(1),k1,k2,d), spring_plat(W(2),k1,k2,d)]; plot(W,1000*x,'-s'), xlabel('Wt (N)'), ylabel('Compression (mm)'),... title('Below-Critical Load') end