RECTILINEAR KINEMATICS: ERRATIC MOTION
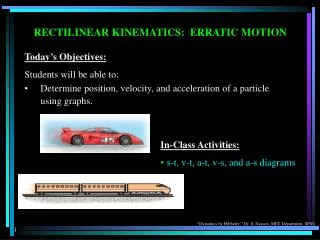
RECTILINEAR KINEMATICS: ERRATIC MOTION. Today’s Objectives: Students will be able to: Determine position, velocity, and acceleration of a particle using graphs. In-Class Activities: s-t, v-t, a-t, v-s, and a-s diagrams. APPLICATION.

RECTILINEAR KINEMATICS: ERRATIC MOTION
E N D
Presentation Transcript
RECTILINEAR KINEMATICS: ERRATIC MOTION Today’s Objectives: Students will be able to: • Determine position, velocity, and acceleration of a particle using graphs. In-Class Activities: • s-t, v-t, a-t, v-s, and a-s diagrams
APPLICATION In many experiments, a velocity versus position (v-s) profile is obtained. If we have a v-s graph for the motorcycle, can we determine its acceleration at position s = 150 feet? How?
ERRATIC MOTION (Section 12.3) Graphing provides a good way to handle complex motions that would be difficult to describe with formulas. Graphs also provide a visual description of motion and reinforce the calculus concepts of differentiation and integration as used in dynamics. The approach builds on the facts that slope and differentiation are linked and that integration can be thought of as finding the area under a curve.
S-T GRAPH Plots of position vs. time can be used to find velocity vs. time curves. Finding the slope of the line tangent to the motion curve at any point is the velocity at that point (or v = ds/dt). Therefore, the v-t graph can be constructed by finding the slope at various points along the s-t graph.
V-T GRAPH Plots of velocity vs. time can be used to find acceleration vs. time curves. Finding the slope of the line tangent to the velocity curve at any point is the acceleration at that point (or a = dv/dt). Therefore, the a-t graph can be constructed by finding the slope at various points along the v-t graph.
V-T GRAPH Also, the distance moved (displacement) of the particle is the area under the v-t graph during time t.
A-T GRAPH Given the a-t curve, the change in velocity (v) during a time period is the area under the a-t curve. So we can construct a v-t graph from an a-t graph if we know the initial velocity of the particle.
s2 ½ (v1²– vo²) = = area under the ò a ds s1 a-s graph A-S GRAPH A more complex case is presented by the a-s graph. The area under the acceleration versus position curve represents the change in velocity (recall òa ds = ò v dv ). This equation can be solved for v1, allowing you to solve for the velocity at a point. By doing this repeatedly, you can create a plot of velocity versus distance.
V-S GRAPH Another complex case is presented by the v-s graph. By reading the velocity v at a point on the curve and multiplying it by the slope of the curve (dv/ds) at this same point, we can obtain the acceleration at that point. a = v (dv/ds) Thus, we can obtain a plot of a vs. s from the v-s curve.
EXAMPLE Given: v-t graph for a train moving between two stations Find: a-t graph and s-t graph over this time interval Think about your plan of attack for the problem!
a(ft/s2) 4 3 t(s) -4 3 EXAMPLE (continued) Solution: For the first 30 seconds the slope is constant and is equal to: a0-30 = dv/dt = 40/30 = 4/3 ft/s2 Similarly, a30-90 = 0 and a90-120 = -4/3 ft/s2 30 90 120
s(ft) 3600 The area under the v-t graph represents displacement. Ds0-30 = ½ (40)(30) = 600 ft Ds30-90 = (60)(40) = 2400 ft Ds90-120 = ½ (40)(30) = 600 ft 3000 600 t(s) 30 90 120 V is increasing (increasing slope) V is constant (constant slope) V is decreasing (decreasing slope) EXAMPLE (continued)
READING QUIZ 1. The slope of a v-t graph at any instant represents instantaneous A) velocity. B) acceleration. C) position. 2. Displacement of a particle in a given time interval equals the area under the ___ graph during that time. A) a-t B) a-s C) v-t C) s-t
CONCEPT QUIZ 1. If a particle starts from rest and accelerates according to the graph shown, the particle’s velocity at t = 20 s is A) 200 m/s B) 100 m/s C) 0 D) 20 m/s 2. The particle in Problem 1 stops moving at t = _______. A) 10 s B) 20 s C) 30 s D) 40 s
GROUP PROBLEM SOLVING Given: The v-t graph shown Find: The a-t graph, average speed, and distance traveled for the 30 s interval Plan: Find slopes of the curves and draw the v-t graph. Find the area under the curve--that is the distance traveled. Finally, calculate average speed (using basic definitions!).
a(ft/s²) 8 1 t(s) 30 10 GROUP PROBLEM SOLVING (continued) Solution: For 0 ≤ t ≤ 10 a = dv/dt = 0.8 t ft/s² For 10 ≤ t ≤ 30 a = dv/dt = 1 ft/s²
GROUP PROBLEM SOLVING (continued) Ds0-10 = ò v dt = (1/3) (.4)(10)3 = 400/3 ft Ds10-30 = ò v dt = (0.5)(30)2 + 30(30) – 0.5(10)2 – 30(10) = 1000 ft s0-30 = 1000 + 400/3 = 1133.3 ft vavg(0-30) = total distance / time = 1133.3/30 = 37.78 ft/s
v 75 t 6 s 2. Select the correct a-t graph for the velocity curve shown. A) B) C) D) a a v t t a a t t t ATTENTION QUIZ 1. If a car has the velocity curve shown, determine the time t necessary for the car to travel 100 meters. A) 8 s B) 4 s C) 10 s D) 6 s