The Calculation
The Calculation. The Calculation (Converting samples to event prediction for the same luminosity). SUSY LM2 Calculation. In order to generate these soups by mixing processes with different cross-sections the CSA07 weight producer was implemented to normalize

The Calculation
E N D
Presentation Transcript
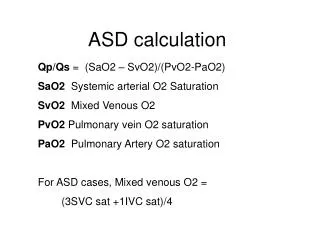
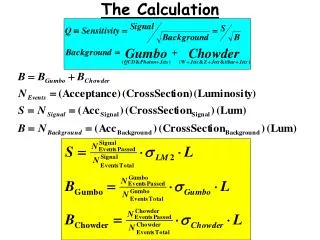
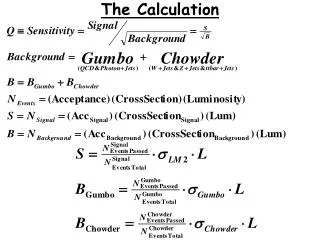
The Calculation(Converting samples to event prediction for the same luminosity) SUSY LM2 Calculation In order to generate these soups by mixing processes with different cross-sections the CSA07 weight producer was implemented to normalize all cross-sections for the different process for each event to 1000 pb-1 (1 fb-1) Thus to calculate the effective cross-section for the different soups (we will assume A = 1) Background Calculation
The Calculation (To calculate what sensitivity looks like as a function of Luminosity for our preliminary cuts)
The CalculationDoing the optimization for the MET Cut Note: This is with the Jet cuts as well…I just left those off for brevity And so on for all the different cuts…
Signal + Gumbo + Chowder Gumbo + Chowder Chowder
This is WITH the optimized MET cut All other cuts held constant!
I don’t know which plot show “more” so I include both SUSY LM2 MET Gumbo MET Chowder MET Just for clarity these are the results from the Prelim cuts…not with the optimized MET cut in place
Extra Plots for these distributions Normalized Jet1 Et Distributions Normalized Jet1 Et Distributions Gumbo MET SUSY LM2 MET Normalized Jet1 Et Distributions Just for clarity these are the results from the Prelim cuts…not with the optimized MET cut in place Chowder MET
I’m unsure what to make of this…? if we go much lower our lead jet will be lower than our 2nd Jet Et that we initially chose I don’t know which plot show “more” so I include both SUSY LM2 MET Gumbo MET Chowder MET Just for clarity these are the results WITH OPTOMIZED MET VALUE (MET > 310 GeV) already in place
Summary of 1st Optimal Cuts Look at other useful quantities to reject background…start with R1 for Jet1, Jet2, and MET
Un-Normalized R2 Distributions All other cuts held constant! LM2 Gumbo Thought this cut would help…the distribution shown here is what this variable looked like after the Preliminary cuts…but after optimizing for Jet Et and MET and R1 this variable looses discriminating power Chowder
Stuff for an aside…. Normalized # of Events
SUSY LM2 MET Gumbo MET Chowder MET
Extra Plots for these distributions Un-Normalized MET Distributions Normalized MET Distributions SUSY LM2 MET Gumbo MET Gumbo MET Chowder MET Normalized MET Distributions Normalized MET Distributions SUSY LM2 MET Chowder MET