Download
1 / 36
360 likes | 545 Vues
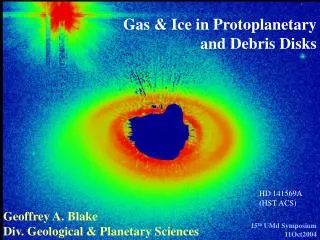
Gas & Ice in Protoplanetary and Debris Disks. HD 141569A (HST ACS). Geoffrey A. Blake Div. Geological & Planetary Sciences. 15 th UMd Symposium 11Oct2004. Study Isolated Disks (Weak/No Outflow). Planet building phase. Beckwith & Sargent 1996, Nature 383 , 139-144. 11Oct2004.

E N D
Gas & Ice in Protoplanetary and Debris Disks HD 141569A (HST ACS) Geoffrey A. Blake Div. Geological & Planetary Sciences 15th UMd Symposium 11Oct2004
Study Isolated Disks (Weak/No Outflow) Planet building phase Beckwith & Sargent 1996, Nature383, 139-144. 11Oct2004
Why do we care about gas & ice in disks? Disk-star- and protoplanet interactions lead to migration while the gas is present. Core- accretion & ice? Theory 1 AU at 140 pc subtends 0.’’007. Jupiter (5 AU): V_doppler = 13 m/s V_orbit = 13 km/s Simulation G. Bryden Observation?
Spectroscopy of “Disk Atmospheres” G.J. van Zadelhoff 2002 Chiang & Goldreich 1997 IR disk surface within several – several tens of AU (sub)mm disk surface at large radii, disk interior 11Oct2004
The 1-Baseline Heterodyne Interferometer: • HST resolution at 1mm • D=10 km! Use array. • Can’t directly process 100 – • 1000 GHz signals. • Heterodyne receivers detect • |V| and f, noise defined by • the quantum limit of hn/k. • Positional information is • carried by the PHASE. • Spectral coverage depends • on the receivers, while the • kinematic resolution is • determined by correlator. Geometrical delay 11Oct2004
The n-Element Heterodyne Interferometer: • n(n-1)/2 baselines, imaging performance depends on the array geometry, but • For small to moderate n, the (u,v) plane is sparsely filled. • For a given array, the minimum detectable temperature varies as (resolution = qS)-2 : qP = primary telescope beam 11Oct2004
CO traces disk geometry, velocity field: CO 3-2 Qi et al. 2004, ApJL, in press. TW Hya w/SMA
Disk Ionization Structure: CO and Ions Disk properties vary widely with radius, height; and depend on accretion rate, etc. (Aikawa et al. 2002, w/ D’Alessio et al. disk models). Currently sensitive only to R>80 AU in gas tracers, R<80 AU dust. CO clearly optically thick, isotopes reveal extensive depletion, poor mass tracer! The fractional ionization is ≥10-9, easily sufficient for MRI transport.
Are there gas probes of the disk midplane? If depletion is extensive, what species might be able to probe the disk midplane? One possible route involves deuterated ions such as H2D+: Ceccarelli et al. 2004, ApJ 607, L51 The abundances of these ions may be difficult to quantify, however, and so SOFIA/Herschel studies of HD J=1-0 at 112 mm are eagerly awaited! Van Dishoeck et al. 2003, A&A 400, L1 TW Hya TMB (K) vLSR (km/s)
Chemical Imaging of Outer Disk? Qi et al. 2004 & in prep HDO formed via H2D+, possible tracer of H3+? Kessler et al. 2004, in prep (6 transits) CO well mixed, while [CN]/[HCN] traces enhanced UV fields, esp. Ly a. Is LkCa 15 unusual? Photodesorption?
Transitional/Debris Disks? HD141569 & Vega w/PdBI: Vega, Wilner et al. 2002 (dust) CO 2-1 from HD141569 J.-C. Augereau & A. Dutrey astro-ph/0404191
Future of the University Arrays – CARMA 01Oct2004 CARMA = OVRO (6 10.4m) + BIMA (9 6.1m) + SZA (8 3.5m) arrays March 27th , 2004 SUP approved! 2004 SZA at OVRO 2004 move 6.1m 2004 move 10.4m 2005 full operations Cedar Flat 7300 ft.
Disk Observations w/CARMA+ALMA CARMA ALMA Md=0.01Msun Rout=120AU Ro=20AU HDO: rms (3sigma) = 0.05-0.1 K (CARMA w/D config. in 4 hrs) Dust simulation (L.G. Mundy), realistic phase errors, but no CLEAN/MEM.
How can we probe the planet-forming region? (pre-ALMA) The size scales are too small even for the largest current & near-term arrays. Spectroscopy to the rescue! Theory Jupiter (5 AU): V_doppler = 13 m/s V_orbit = 13 km/s Observation?
R=10,000-100,000 (30-3 km/s) echelles (ISAAC,NIRSPEC, PHOENIX,TEXES) on 8-10 m telescopes can now probe “typical” T Tauri/Herbig Ae stars: High Resolution IR Spectroscopy & Disks Keck CO M-band TW Hya NIRSPEC R=25,000 L1489 IRS
Spitzer can study edge-on disks! VLT VLT The small molecules in ices are similar in protostellar envelopes and disks. Flux (Jy) ISAACS 11Oct2004
What about other gaseous species w/echelles? NGC 7538 IRS9 Boogert et al. 2004, ApJ, in press 11Oct2004
In older/inclined systems, CO disk emission: Herbig Ae stars, from ~face-on (AB Aur) to highly inclined (HD 163296). CO lines correlated with inclination and much narrower than those of H I Disk! CO lines give distances slightly larger than K-band interferometry, broad H I traces gas much closer to star (see also Brittain & Rettig 2002, ApJ, 588, 535; Najita et al. 2003, ApJ, 589, 931). Can do ~20-30 objects/night. Pf b
Systematic Line Width Trends: • Objects thought to be ~face on have the narrowest line widths, highly inclined systems the largest. • As the excitation energy increases, so does the line width (small effect). • Consistent with disk emission, radii range from 0.5-5 AU at high J. • Low J lines also resonantly scatter 5 mm photons to much larger distances. • Asymmetries (VV Ser)? Blake & Boogert 2004, ApJL 606, L73. 11Oct2004
How is the CO excited in these disks? CO and 13CO rotation diagrams show curvature as a result of t>1. Still, small amounts of gas since N(H2)~5 x 10²² leads to dust opacities near unity. CO 13CO Collisional excitation important, but cannot explain line widths at low J values (too broad). Resonant IR scattering at larger radii! The vibrational excitation is highly variable, likely due to variations in the UV field. Disk shadowing? 11Oct2004
Where does the CO emission come from? Flared disk models often possess 2-5 micron deficiency in model SEDs, where a “bump” is often observed for Herbig Ae stars. Dullemond et al. 2002 Explanation: Dust sublimation near the star exposes the inner disk to direct stellar radiation, heating the dust and “puffing up” the disk. 11Oct2004
CO Emission from Transitional Disks? For dust sublimation alone, the lines from T Tauri disks should be broader than those from Herbig Ae stars+disks. Often observed, but… Calvet et al. 2002 The TW Hya lines are extremely narrow, with i~7° R≥0.4 AU. Similar for SR 9 and DoAr 44, but gas radius << dust radius (SED)? Recall hnCO≥ 11.09 eV to dissociate.
Gas Tracers in Debris Disks? What about H2? Controversial ISO SWS studies were in LARGE beams, truly disk emission? TEXES, Richter et al. (2004), in preparation. Spitzer IRS? Calvet et al. 2002 TEXES/IRTF ground based follow up has now detected H2 in cTTs, narrow & point-source like. Debris disks studies need 8-10m! (2005B)
AB Aur HD 163296 Disk Spectroscopy - Conclusions (Sub)mm-wave instruments can only study the outer reaches of large disks at present in lines; even at these wavelengths the disk mid-plane is largely inaccessible due to molecular depletion. Expanded arrays (CARMA, eSMA, ALMA) will provide access to much smaller scales, lines may selectively highlight regions of planet formation. Midplane w/H2D+ and HD? High resolution IR spectroscopy just starting, is immensely powerful, and provides unique access to the 0.5-50 AU disk surface before advent of ALMA, large IR interferometers. Spectra are esp. sensitive to disk geometry. Spitzer is providing beautiful spectrophotometric SEDs and many new targets! 11Oct2004
OVRO CO(2-1) Survey of T Tauri stars (Koerner & Sargent 2003) • stellar ages 1 - 10 Myrs • stellar masses ~ 1 M • selection by 1 mm flux, SED characteristics • Taurus 19/19 detections • Ophiuchus 4/6 detections • resolution ~ 2” 20 objects radii 150 AU masses 0.02 M (from SEDs) See also Dutrey, Guilloteau, & Simon, Ohashi
Chemical / Radiative Transfer Modeling Physical model: D'Alessio et al. 2001 Chemical model: Willacy& Langer 2001 Radiative transfer: Hogerheijde & vander Tak 2000 Understanding Disk Chemistry Molecular line survey UV fields grain reactions disk ages and evolution
MM-Wave CO Traces Dynamics, Others? D. Koerner & A. Sargent OVRO, in Qi et al. (2004). Measure: R_disk M_star Inclination w/resolved images. LkCa 15 LkCa 15 Dutrey et al. 1997, IRAM 30m 11Oct2004
OVRO+CSO/JCMT MM-Wave Disk Survey II van Zadelhoff et al. 2001 Combine 3/1.3 mm array images w/higher J spectra to constrain OUTER disk properties, chemical networks. 11Oct2004
Source L*(L ) CN/HCN Hdust/hgas LkCa 15 0.72 ~ 10 1.0 GM Aur 0.80 << 1 4.0 MWC 480 30.2 ~ 4 1.7 HD 163293 35.2 >> 50 - UV Fields: HCN and CN [CN]/[HCN] traces enhanced UV fields (Fuente et al. 1993, Chiang et al. 2001) LkCa 15 Molecular distribution ring-like? Photochemistry or desorption? Qi et al., in prep 11Oct2004
8.9 8.2 7.6 6.9 6.3 9.5 5.0 5.6 4.3 3.0 3.7 LkCa15 ___ model - - - CO 2-1 fit Modeling the effects of (uv) Sampling Model Parameters i = 58°, Vturb= 0.1 km/s Ro= 5 AU, Rout= 430 AU nCO = 10-4 nH (D'Alessio 2001) qsyn = 3.6” x 3.6” Infinite resolution, complete UV coverage Observed UV sampling, uniform weighting
Atmospheric Phase Correction (mm Adaptive Optics) • Atm. fluctuations (mostly • H2O)can vary geom. delay. • |V|eif decorrelation • if Ef>p (each baseline). • If the fluctuations vary • systematically across the • array, phase errors ensue. • Problem is NOT solved. OVRO WLM System
Enter ALMA: Dust simulation (L.G. Mundy), realistic phase errors, but no CLEAN/MEM. Superb site & large array exceptional performance (64 12m telescopes, by 2012). Llano de Chajnantor; 5000 m, good for astronomy, tough for humans!
Ices in the disk of L1489 IRS • Prominent band of solid CO detected toward L1489, originating in large, flaring disk. • CO band consists of 3 components, explained by laboratory simulations as originating from CO in 3 distinct mixtures: • 'polar' H2O:CO • 'apolar' CO2:CO [NEW!] • 'apolar' pure CO (Boogert, Hogerheijde & Blake, ApJ 568,761, 2002)
Ices toward young low mass stars Boogert et al. 2004, ApJS 154, 359 HH 46 w/IRAC, IRS Keck/VLT +Spitzer 11Oct2004
SED Fits versus IR Interferometry Fits to AB Aur SED yield an inner radius of ~0.5 AU (and 0.06 AU for T Tau). (Monnier & Millan-Gabet 2002, ApJ) Dullemond et al. 2002 This model can now be directly tested via YSO size determinations with K-band interferometry. Intense dust emission pumps CO, rim “shadowing” can produce moderate T_rot.
Future “Near”-IR (1-5 mm) Spectroscopy Brittain & Rettig 2002, Nature Many other species and disk types (transitional, debris, etc.) should be examined in both absorption (edge-on disks) and emission, but extremely high dynamic range will be needed. Protoplanet tracers? H2, H3+, CH4, H2O, OCS... Line profile asymmetries?