Download
1 / 130
1.42k likes | 2.07k Vues
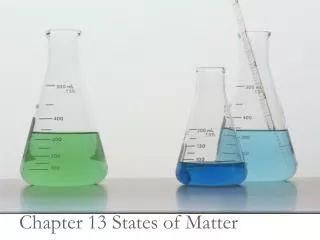
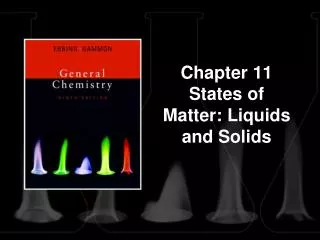
Chapter 11 States of Matter: Liquids and Solids. Contents and Concepts. Comparison of Gases, Liquids, and Solids Changes of State Phase Transitions Phase Diagrams. Liquid State Properties of Liquids: Surface Tension and Viscosity Intermolecular Forces; Explaining Liquid Properties.

E N D
Contents and Concepts • Comparison of Gases, Liquids, and Solids Changes of State • Phase Transitions • Phase Diagrams
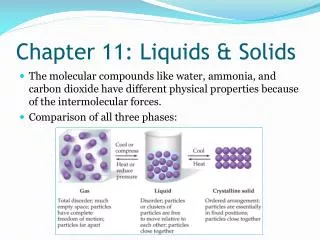
Liquid State • Properties of Liquids: Surface Tension and Viscosity • Intermolecular Forces; Explaining Liquid Properties
Solid State • Classification of Solids by Type of Attraction of Units • Crystalline Solids; Crystal Lattices and Unit Cells • Structures of Some Crystalline Solids • Calculations Involving Unit-Cell Dimensions • Determining Crystal Structure by X-Ray Diffraction
Learning Objectives • Comparison of Gases, Liquids, and Solids • a. Recall the definitions of gas, liquid, and solid given in Section 1.4. • b. Compare a gas, a liquid, and a solid using a kinetic molecular theory description. • c. Recall the ideal gas law and the van der Waals equation for gases (there are no similar simple equations for liquids and solids).
Changes of State 2. Phase Transitions Define change of state (phase transition). Define melting, freezing, vaporization, sublimation, and condensation. Define vapor pressure. Describe the process of reaching a dynamic equilibrium that involves the vaporization of a liquid and condensation of its vapor.
2. Phase Transitions (con’t) Describe the process of boiling. Define freezing point and melting point. Define heat (enthalpy) of fusion and heat (enthalpy) of vaporization. Calculate the heat required for a phase change of a given mass of substance.
2. Phase Transitions (con’t) Describe the general dependence of the vapor pressure (ln P) on the temperature (T). State the Clausius–Clapeyron equation (the two-point form). Calculate the vapor pressure at a given temperature. Calculate the heat of vaporization from vapor pressure.
3. Phase Diagrams Define phase diagram. Describe the melting-point curve and the vapor-pressure curves (for the liquid and the solid) in a phase diagram. Define triple point. Define critical temperature and critical pressure. Relate the conditions for the liquefaction of a gas to its critical temperature.
Liquid State • 4. Properties of Liquids; Surface Tension and Viscosity • Define surface tension. • Describe the phenomenon of capillary rise. • Define viscosity.
5. Intermolecular Forces; Explaining Liquid Properties • Define intermolecular forces. • Define dipole–dipole force. • Describe the alignment of polar molecules in a substance. • Define London (dispersion) forces. • Note that London forces tend to increase with molecular mass.
5. Intermolecular Forces; Explaining Liquid Properties (con’t) • Relate the properties of liquids to the intermolecular forces involved. • Define hydrogen bonding. • Identify the intermolecular forces in a substance. • Determine relative vapor pressures on the basis of intermolecular attractions.
Solid State • 6. Classification of Solids by Type of Attraction of Units • Define molecular solid, metallic solid, ionic solid, and covalent network solid. • Identify types of solids. • Relate the melting point of a solid to its structure. • Determine relative melting points based on types of solids. • Relate the hardness and electrical conductivity of a solid to its structure.
7. Crystalline Solids; Crystal Lattices and Unit Cells • Define crystalline solid and amorphous solid. • Define crystal lattice and unit cell of a crystal lattice. • Define simple cubic unit cell, body-centered cubic unit cell, and face-centered cubic unit cell. • Determine the number of atoms in a unit cell. • Describe the two kinds of crystal defects.
8. Structures of Some Crystalline Solids • Define hexagonal close-packed structure and cubic close-packed structure. • Define coordination number. • Note the common structures (face-centered cubic and body-centered cubic) of metallic solids. • Describe the three types of cubic structures of ionic solids. • Describe the covalent network structure of diamond and graphite.
9. Calculations Involving Unit-Cell Dimensions • Calculate atomic mass from unit-cell dimension and density. • Calculate unit-cell dimension from unit-cell type and density. • 10. Determining Crystal Structure by X-Ray Diffraction • Describe how constructive and destructive interference give rise to a diffraction pattern. • Note that diffraction of x rays from a crystal gives information about the positions of atoms in the crystal.
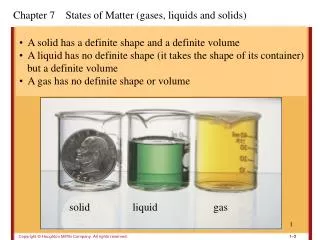
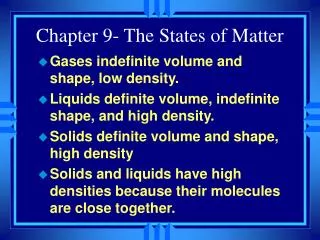
Comparing Gases, Liquids, and Solids • Gases are compressible fluids. • Liquids are relatively incompressible fluids. • Solids are nearly incompressible and rigid.
A change of state or phase transition is a change of a substance from one state (solid, liquid, gas) to another. The specific name or names for each of these transitions are given below.
The vapor pressure of a liquid at a particular temperature is the partial pressure of the vapor over the liquid measured at equilibrium. • When a liquid is placed in a closed vessel, the partial pressure of its vapor increases over time until it reaches equilibrium. At equilibrium, evaporation and condensation continue to occur, but do so at the same rate. This situation, which is called a dynamic equilibrium, is illustrated on the next slide.
The vapor pressure depends on the liquid and on the temperature. This relationship is illustrated on the next slide for four substances. Note that as temperature increases, vapor pressure increases.
The boiling point is the temperature at which the vapor pressure is equal to the pressure on the liquid, usually atmospheric pressure. At this temperature, bubbles of gas form within the liquid, as illustrated in the figure. The normal boiling point is measured at 1 atmosphere pressure.
When the pressure on the liquid increases, as is the case with a pressure cooker, the boiling point increases. • Conversely, when the pressure on the liquid decreases, as is the case at high altitude, the boiling point decreases.
The freezing point is the temperature at which a pure liquid changes to a crystalline solid (or freezes). • The melting point is the temperature at which a crystalline solid changes to a liquid (or melts).
Any change of state requires that energy be added to or removed from the system. As shown in the graph, for water, there are two regions that remain at the same temperature even as heat is added. Those represent regions of phase change.
The heat of fusion, DHfus, is the heat needed to melt a solid. It is given in kJ/mol. • For water, the phase change is represented by • H2O(s) H2O(l); DHfus = 6.01 kJ/mol • The heat of vaporization, DHvap, is the heat needed to vaporize a liquid. It is given in kJ/mol. • For water, the phase change is represented by • H2O(l) H2O(g); DHvap = 40.7 kJ/mol
Shown to the right is a representation of a closed container in which you have just placed 10 L of H2O. This is the starting point in time, t = 0. • Assume that all of the water is in the liquid phase at this point. The dots represent a few of the H2Omolecules.
Consider a time t = 1, when some time has passed but the system has not reached equilibrium. • How will the level of the liquid H2O compare to that at t =0? • How will the vapor pressure in the flask compare to that at t = 0? • How will the number of H2O molecules in the vapor state compare to that at t = 0? • How does the rate of evaporation in this system compare to the rate of condensation?
Time t = 1: • The liquid level will be lower than at t = 0. • The vapor pressure will be higher than at t = 0. • There will be more molecules of H2O in the vapor state than at t = 0. • The rate of evaporation is greater than the rate of condensation.
Consider a time t = 2, when enough time has passed for the system to reach equilibrium. • How will the level of the liquid H2O compare to that at t = 1? • How will the vapor pressure in the flask compare to that at t = 1? • How will the number of H2O molecules in the vapor state compare to that at t = 1? • How does the rate of evaporation in this system compare to the rate of condensation?
Time t = 2 (the system is at equilibrium): • The liquid level will be lower than at t = 1. • The vapor pressure will be higher than at t = 1. • There will be more molecules of H2O in the vapor state than at t = 1. • The rate of evaporation is equal to the rate of condensation.
When vapor pressure is plotted versus temperature, a curve is obtained. • When the natural log (ln P) of the vapor pressure is plotted against the reciprocal of temperature (1/T), a straight-line graph is obtained. • The next slide shows this graph for four liquids.
The Clausius–Clapeyron equation describes these graphs: • R = 8.314510 J/(mol K) • DHvap must be given in J/mol • This equation can be used to find the vapor pressure, the heat of vaporization, or the temperature.
The fuel requirements of some homes are supplied by propane gas, C3H8, which is contained as a liquid in steel cylinders. If a home uses 2.40 kg of propane in an average day, how much heat must be absorbed by the propane cylinder each day to evaporate the liquid propane, forming the gas that is subsequently burned? The heat of vaporization of propane is 16.9 kJ/mol.
We want to know how much heat it takes to evaporate 2.40 kg of propane, which has a heat of vaporization of 16.9 kJ/mol. • We will convert kilograms to grams, then grams to moles, and finally moles to kilojoules. 9.20 × 10² kJ
The vapor pressure of diethyl ether (commonly known as simply ether) is 439.8 mmHg at 20.0°C. The heat of vaporization of ether is 29.2 kJ/mol. What is the vapor pressure of ether at 34.0°C?
This problem uses the Clausius–Clapeyron equation. When setting up your variables, it simplifies your math if you let P2 be the unknown vapor pressure. P1 = 439.8 mmHg T1 = 20.0°C P2 = ? T2 = 34°C DHvap = 29.2 kJ/mol Units are critical when working with this equation: Temperatures must be in K, and DHvap in J/mol.
P1 = 439.8 mmHg T1 = 293°C P2 = ? T2 = 307°C DHvap = 29.2 x 10³ J/mol
P2 = Solve the right side first: Use ex or inverse ln 760 mmHg (3 significant figures)
A phase diagram is a graphical way to summarize the conditions under which the various states of a substance are stable.
In a phase diagram, phases are separated by lines that represent equilibrium between those phases. • The triple point is the point where all three phases are in equilibrium.
The phase diagram for water illustrates the components described on the previous slide. The slope of the AB line, which shows the equilibrium between solid and liquid, slants to the left. This is because the density of the liquid is greater than the density of the solid.
The phase diagram for carbon dioxide is given at right. Note that the AB line slants to the right. • At STP, carbon dioxide is never a liquid. That is why carbon dioxide sublimes directly from solid to gas.
The phase diagram for sulfur shows some interesting characteristics. The existence of two different solid structures for sulfur, rhombic and monoclinic, gives rise to more than one triple point.
The critical point gives the temperature (critical temperature, TC) at which the liquid state can no longer exist and the pressure at that temperature (critical pressure). Above this temperature and pressure, there is only one state, a supercritical fluid. This is illustrated below for CO2, for which TC = 31°C.
At 3200 m, the pressure on the liquid is less than at sea level, which means the boiling point is lower. The eggs will need to be cooked longer at the higher altitude.
Now we will look at some properties of liquids: surface tension and viscosity.
Surface tension is the energy required to increase the surface area of a liquid by a unit amount. The values are given in J/m2. Surface tension arises because the molecules at the surface of a liquid experience a net force toward the center of the liquid.