Download
1 / 27
270 likes | 399 Vues
NOAA GIFTS Demonstration Excerpted from GIFTS Product Assessment Plan P. Menzel May 2002. The long and winding road from ATS to ABS: Evolving the Geosynchronous Observations of the Atmosphere. ATS, SMS, VISSR, METEOSAT, VAS, GOES, GAP, GHIS, GIFTS, ABS

E N D
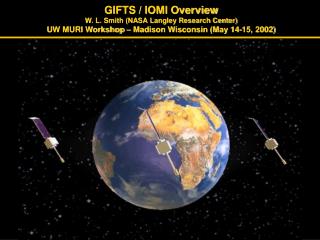
NOAA GIFTS Demonstration Excerpted from GIFTS Product Assessment Plan P. Menzel May 2002
The long and winding road from ATS to ABS:Evolving the Geosynchronous Observations of the Atmosphere ATS, SMS, VISSR, METEOSAT, VAS, GOES, GAP, GHIS, GIFTS, ABS Getting Ready for Anticipated Capabilities
NOAA GIFTS Demonstration goals are to establish ground reception site (Wallops with UW backup) establish seasonal suites of routine schedules for GIFTS distribute level 1b radiances in real time to NWP and research centers via ground com lines distribute derived product images to NWS FOs in virtual lab archive all level 1b data and some of the derived products test NWP assimilation approaches of radiances and winds study impact of GIFTS images and derived products on forecasting / nowcasting at NWS FOs establish ABS utilization approaches for day one
NOAA GIFTS Demonstration will engage NESDIS/ORA to plan/conduct GIFTS science studies NESDIS/OSD to infuse GIFTS technology in ABS NESDIS OSDPD to help plan data distribution NESDIS Coop Insts to develop algorithms and derived products NWS NCEP to test GIFTS impact EMC for data assimilation SPC, AWC, TPC, HPC for derived products FOs for operational real time utilization NCDC for archive management
NOAA GIFTS Demonstration plan includes * GIFTS Level 0 Data Acquisition primary ground system at Wallops backup at UW access to full data stream at UW * Data and Metadata Archive some raw data (for NMP team) initially all Level 0 data (for NOAA reprocessing to level 1 with improved algorithms) evolves to Level 1 archive of “golden year” at NCDC * Real Time Data Processing Level 0 to Level 1 using software with real time efficiency provided by NOAA Level 1 to 2+ using algorithms and software developed by largely at UW/CIMSS * Demonstration of Utility of GIFTS Data and Products and Distribution to End-Users participation in cal/val intercomparisons of radiances and products real time distribution of GIFTS radiances (compressed or subset) and winds to EMC for NWP impact studies real time web access by selected NWS FOs to multispectral and derived product images of atmospheric water vapor, stability, cloud properties, land surface temperatures,… research on SST, volcanic ash, ERB, trace gases spans winter storms in eastern Pacific (Feb, Mar), severe storms in Midwest (Apr, May, Jun, Jul), and hurricanes in Atlantic (Aug, Sep, Nov) runs 24 hours per day seven days a week amap during demonstration year * NWP impact & research continues with Australian BofM after drift to Indian Ocean
NOAA GIFTS Demonstration tasks are Data reception and processing (OSD/SSEC) Archive (NCDC/SSEC) Data Compression (OSD/ORA/CIMSS) Algorithm development (ORA/CIMSS) Data Assimilation (EMC/ORA/CIMSS) GIFTS ABS Synergy (OSD/ORA) Operational Validation (ORA/CIMSS with NASA) Data Assimilation (EMC/CIMSS) Data Transmission (OSD) Model Impact Tests (EMC/ORA/CIMSS) Nowcasting Development (NWS/CIMSS)
Algorithm development will address GOES products soundings winds cloud properties land surface products ocean products earth radiation budget ozone / trace gases / volcanic ash Derived product images will include 3 layers of moisture and total column atmospheric stability cloud temperature and phase land surface temperature diurnal excursions
Evolution of stability seen in GOES LI DPI 18 16 14 12 (12 to 18 UT) Java animation: anigli3m.html
Evolution of profiles retrieved from the GOES Sounder (12 to 18 UT) Java animation: anisks3m.html
View from space OK tornado 3 May 99 1800 UTC View from ground 530 CDT (2330 UTC) 2300 UTC
GOES axis of high LI indicates subsequent storm track 24 Jul 2000
NWS Forecast Office Assessment ofGOES Sounder Total Precipitable Water Summer 99 Forecaster assessment of usefulness of changes in hourly TPW product for precipitation forecast Out of 207 weather cases. - Significant Positive Impact (21.3%) - Slight Positive Impact (50.2%) - No Discernible Impact (27%) - Slight Negative Impact (1%) - Significant Negative Impact (<1%) Figure from the National Weather Service, Office of Services
High Density Winds associated with Hurricane Bonnie
Geo Interferometer creates new opportunities for improved AMVs: Simulated Hurricane Bonnie winds by tracking features in water vapor retrievals from high spectral resolution IR data
(~1600) Evolving to more capable Geostationary Sounders (# of channels) Advanced Baseline Sounder (operational) (~1600) GIFTS (experimental) (18) GOES Sounder (operational) ABS is next step after GIFTS on path from low spectral resolution to high-spectral resolution operational sounders. (12) VAS (experimental) time
GOES Sounder Spectral Coverage Current sounder has 18 infrared bands; ABS will have more than 1600 Higher spectral resolution leads to improved vertical resolving power.
GIFTS and ABS’ use the shortwave side of the water vapor band.
These water vapor weighting functions reflect the radiance sensitivity of the specific channels to a water vapor % change at a specific level (equivalent to dR/dlnq scaled by dlnp). Moisture Weighting Functions Pressure Weighting Function Amplitude Wavenumber (cm-1) UW/CIMSS The advanced sounder has more and sharper weighting functions
Current retrieval strategy: use all channels in a regression for first guess then use a sub-set of channels for physical retrieval
Simulation of Geo-Interferometer detection of low level inversion
Significant Findings from Geo-Interferometer OSSE Geo-Interferometer (Geo-I) sees into Boundary Layer (BL) providing low level (850 RH) moisture information; Geo-Radiometer (Geo-R) only offers information above BL (700 RH) OSSE 12 hr assimilation followed by 12 hr forecast
Possible Nominal Schedules for GIFTS Demo General Schedule Every hour 4*GS (40 min), RS (20 min) Winter Pacific Storms Every hour 3*GS (30 min), 3*RI (10 min), RS (20 min) Severe Spring Storms Every hour 12*RI (40 min), RS (20 min) Atlantic Hurricanes Every hour 3*GS (30 min), 3*RI (10 min), RS (20 min) RI - Regional Imaging over 6,000 km box (at 36 cm-1 res) GI - Global Imaging over 10,000 km box (at 36 cm-1 res) RS - Regional Sounding over 6,000 km box (at 0.6 cm-1 res) GS - Global Sounding over 10,000 km box (at 18 cm-1 res) center of coverage for regional scans adjusted for synoptic situation
Expectations from the Geo-Interferometer * depicts water vapor as never before by identifying small scale features of moisture vertically and horizontally in the atmosphere * tracks atmospheric motions much better by discriminating more levels of motion and assigning heights more accurately * characterizes life cycle of clouds (cradle to grave) and distinguish between ice and water cloud ( which is very useful for aircraft routing) and identify cloud particle sizes (useful for radiative effects of clouds) * measures surface temperatures (land and sea) by accounting for emissivity effects (the improved SSTs would be useful for sea level altimetry applications) * distinguishes atmospheric constituents with improved certainty; these include volcanic ash (useful for aircraft routing), ozone, and possibly methane plus others trace gases.