Download
1 / 15
150 likes | 203 Vues
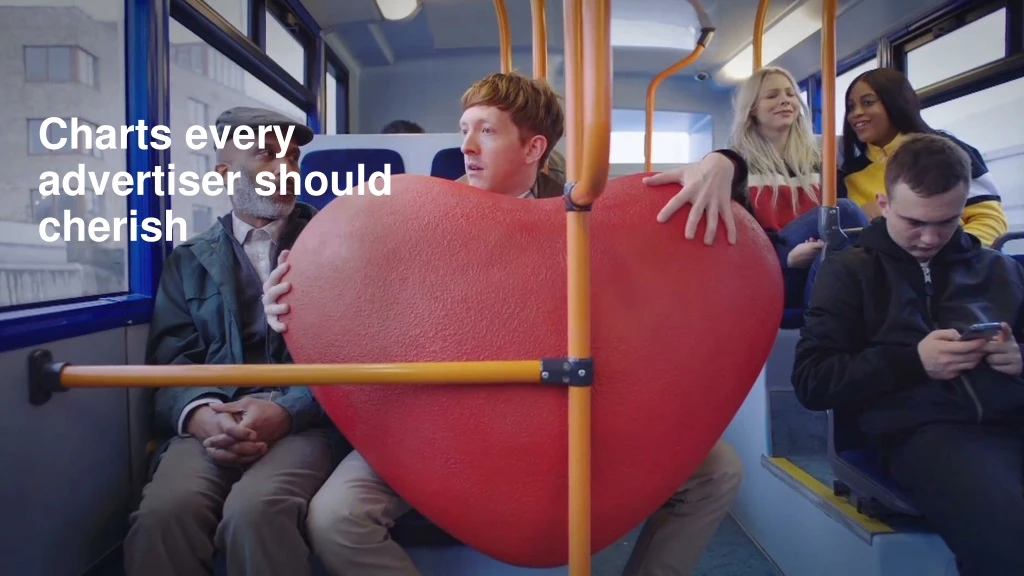
Explore key findings by Les Binet, Alex Steer, Tom Roach, Fran Cassidy, Lorna Hawtin, Peter Field, and Patrick Barwise on balancing short-term sales activation with long-term brand building for optimal advertising ROI. Insights reveal the critical interplay between brand equity and sales activation effects across different product categories and media channels to drive sustained growth. Learn why targeting very light buyers and investing in long-term strategies are essential for maximizing profits and achieving advertising success. Unlock the power of the Zig Zag Chart for a comprehensive view of advertising effectiveness.

E N D
Les Binet: The Zig Zag Chart Key finding: Brand building is always the primary driver. Short-term selling is never enough. “Most marketers assume that, if you look after the short term, the long term will look after itself. This chart explains why this is dangerously wrong.” Les Binet adam&eve\DDB
Brand building Long term growth in base sales Reduced price sensitivity Les Binet: The Zig Zag Chart Sales activation Immediate sales response High efficiency & ROI Time
Alex Steer: Brand:activation ratio, by category Key finding: The ‘60:40’ norm varies by category, but there’s a clear overall relationship between brand and activation effects. “In categories where consumers switch more easily, are swayed by pricing, or research heavily, activation effects tend to be larger – but even here, brand effects always have the edge.” Alex Steer Wavemaker
Alex Steer: Brand:activation ratio, by category ‘Short-term’(Activation effects) ‘Long-term’(Brand equity effects) Source: Wavemaker/BrandZ benchmarks database. (60,000 brand case studies over 11 years)
Tom Roach: Your fans are not your most valuable consumers Key finding: Targeting ‘fans’ who frequently buy the product is likely to make little difference to volume of sales. “At its simplest it just shows the importance to all brands of very light buyers and the relative unimportance of very heavy buyers.” Tom Roach BBH
Tom Roach: Your fans are not your most valuable consumers Incremental numbers of buyers of Pantene Vs. Fructis 000’s OF HOUSEHOLDS BUYING FANS Fructis can’t match Pantene in size by just targeting fans ANNUAL PURCHASE FREQUENCY • Source: Martin Weigel, How to Not Fail. Nielsen
Fran Cassidy: The importance of long-term effects Key finding: 58% of all media impact comes in the long term. “The majority of a company’s value will come from profitable sales made in the future.” Fran Cassidy Consultant
Fran Cassidy:The importance of long-term effects 18% Attribution modelling 42% Short-term econometrics The proportion of total profit revealed by attribution modelling and econometrics 100% The majority of advertising returns (58%) occur in the long-term Holistic studies (long-term and short-term) • Source: ‘Profit Ability: the business case for advertising’, November 2017 • Gain Theory long-term ROI study
Lorna Hawtin: UK investment in the long-term today Key finding: Advertisers are not putting enough money behind their best work. “It shows just how much of the UK’s TV advertising budgets are currently being invested in what appears to be sub-optimal copy.” Lorna Hawtin TBWA
Peter Field: Big Tech use traditional advertising media Key finding: Major tech firms spend on traditional brand media. “Clearly Big Tech are looking more objectively at what works: despite having access to advanced digital tools and data, these companies choose to put ever more money into traditional advertising media.” Peter Field Marketing Consultant
Peter Field: Big Tech use traditional advertising media Source: Nielsen Brands: Amazon, Google, Apple Facebook, Twitter, AirBnB, Uber, Spotify
Patrick Barwise: Proportion of advertising-generated profit by medium Key finding: TV delivers 71% of total profit generated by advertising. “This chart shows that TV generates the highest average three-year return.” Patrick Barwise London Business School
Patrick Barwise: Proportion of advertising-generated profit by medium Bubble size represents % of total profit Total profit = all return (short + long-term) generated over 3 years TV: 71% Print: 18% Online Video: 4% TOTAL PROFIT ROI EFFICIENCY Radio: 3% OOH: 3% BREAK EVEN Online Display: 1% % OF BUDGET • Source: ‘Profit Ability: the business case for advertising’, Nov 2017 • Ebiquity ROI campaign database (Feb’14-May’17) & Gain Theory. Campaign obs: 1,954 NB: Online Video includes Broadcaster VOD, YouTube, Facebook video & online programmatic video