Download
1 / 27
540 likes | 1.75k Vues
Indirect calorimetry —calculates energy expenditure from the respiratory exchange ratio (RER) of VCO 2 and VO 2 . . . Measuring Energy Costs of Exercise. Direct calorimetry —measures the body's heat production to calculate energy expenditure .

E N D
Indirect calorimetry—calculates energy expenditure from the respiratory exchange ratio (RER) of VCO2 and VO2. . . Measuring Energy Costs of Exercise Direct calorimetry—measures the body's heat production to calculate energy expenditure. - Only about 40% of the energy liberated from CHO/fat metabolism is used to produce ATP and the remainder (~60%) is dissipated as heat
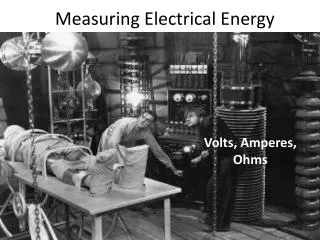
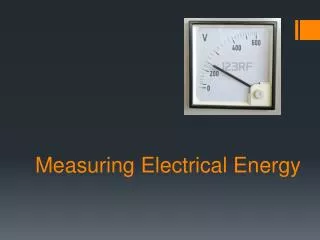
. VO2—volume of O2 consumed per minute (L/min) . VCO2—volume of CO2 produced per minute (L/min) . . . VO2 = (VI´ FIO2) - (VE´ FEO2) . . . VCO2 = (VE´ FECO2) - (VI´ FICO2) . VE= volume of air expired per minute VI= volume of air inspired per minute FIO2= fraction of air inspired that is oxygen FICO2= fraction air inspired that is carbon dioxide FEO2= fraction of air expired that is oxygen FECO2 = fraction of air expired that is carbon dioxide . Measuring Energy Costs of Exercise
Respiratory Quotient (RQ) w The ratio between CO2 released (VCO2) and oxygen consumed (VO2) wRQ = VCO2/VO2 • Measured at the cellular level • Used to estimate substrate (CHO and fat) metabolism • - CHO (e.g., glucose) • C6H12O6 + 6O2 → 6CO2 + 6H2O • i.e., RQ = 6 CO2/6O2 = 1.0 • - Fat (e.g., palmitic acid) • C16H32O2 + 23O2 → 16CO2 + 16H2O • i.e., RQ = 16 CO2/23 O2 = 0.70 • during intense exercise the RER may be 1.00 or above, indicating the body is primarily metabolizing carbohydrate.
. . w RER = VCO2/VO2 Respiratory Exchange Ratio (RER) wMeasured at the nose/mouth • The RER value at rest is usually 0.78 to 0.80, indicating the body is primarily metabolizing fat. • During intense exercise, the RER may be 1.00 or above, indicating the body is primarily metabolizing carbohydrate. • The RER value can be used to determine energy substrate used at rest and during exercise, with a value of 1.00 indicating CHO and 0.70 (0.71) indicating fat. % fat contribution = 100 x (1 − RER)/0.29 e.g., if RER = 0.75, the % fat contribution to metabolism would be 86%
Energy % kcal RER kcal/L O2 Carbohydrates Fats 0.71 4.69 0.0 100.0 0.75 4.74 15.6 84.4 0.80 4.80 33.4 66.6 0.85 4.86 50.7 49.3 0.90 4.92 67.5 32.5 0.95 4.99 84.0 16.0 1.00 5.05 100.0 0.0 Caloric Equivalence of the Respiratory Exchange Ratio (RER) and % kcal From Carbohydrates and Fats
Respiratory Exchange Ratio (RER) • How can RER become higher than 1? • Lactic acid • ↓ carbonic anhydrase • H+ + HCO3-↔ H2CO3 H2O + CO2 • Protein as a fuel?
Metabolic Rate w Rate at which the body expends energy (or uses ATP) w Measured as whole-body oxygen consumption and its caloric equivalent w Basal or resting metabolic rate (BMR/RMR) is the minimum energy required for essential physiological function (varies between 1,200 and 2,400 kcal/24hr), e.g., protein synthesis, ion pumping, etc. w The minimum energy required for normal daily activity:about 1,800 to 3,000 kcal/24hr
Factors Affecting BMR/RMR wFat-free mass wBody surface area wAge wBody temperature wStress wThyroid hormone and epinephrine
. Maximal Oxygen Uptake (VO2max) w Upper limit of a person's ability to increase oxygen uptake. w Good (best) indicator of cardio-respiratory endurance and aerobic fitness. w Can differ according to body size, body composition, (gender, and age), and is greatly influenced by the level of aerobic training. w Either expressed in absolute terms, i.e., liters of O2 consumed per minute(L/min), or expressed relative to body weight in ml of O2 consumed per kg body weight per min(ml · kg-1 · min-1). wVO2max of average college students:
EXERCISE INTENSITY AND OXYGEN UPTAKE wAbsolute vs. Relative Exercise Intensity
Lactate threshold (LT), when expressed as a percentage of VO2max, is one of the best determinants of an athlete's pace in endurance events such as running and cycling. While untrained people typically have LT around 50% to 60% of their VO2max, elite athletes may not reach LT until around 70% or 80% VO2max. . . . Lactate Threshold and Performance
. w High maximal oxygen uptake (VO2max) Determining Endurance Performance Success w High lactate threshold w High economy of effort w High percentage of slow-twitch muscle fibers
Fatigue and Its Causes w Phosphocreatine (PCr) depletion (especially in events lasting less than 30 seconds) w Accumulation of lactate and H+ (especially in events shorter than 30 minutes) • Excitation-contraction uncoupling, i.e., reduced calcium release from SR during excitation of the muscle fiber; occurs during any intense muscular exertion. • Decreased central neural drive (events lasting hours) w Glycogen depletion (especially in activities lasting longer than ~1 hour but no longer than ~3 hours)
MUSCLE FIBERS STAINED TO SHOW GLYCOGEN Myosin ATPase Glycogen At low to moderate exercise intensities, ST fibers are the first to lose glycogen because they are the primary fibers being recruited.
Glycogen depletion at different intensities to exhaustion Powers and Howley, Exercise Physiology, 2004
Metabolic By-Products and Fatigue w Short duration, high intensity activities depend on anaerobic glycolysis and produce lactate and H+. • Cells buffer H+ with bicarbonate (HCO3−) to keep cell pH between 6.4 and 7.1. H+ + HCO3− ↔ H2CO3 ↔ H2O + CO2 Carbonic Anhydrase Metabolism w Intercellular pH lower than 6.9, however, slows all enzyme reactions (including myosin ATPase). w When pH reaches 6.4, H+ levels stop any further glycolysis and result in exhaustion. w Calcium binding
Mechanisms of fatigue Human TA Muscle Baker et al. J ApplPhysiol74: 2294, 1993.