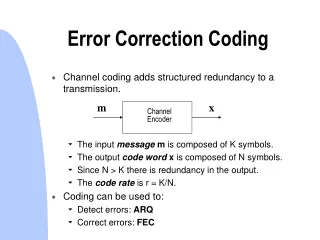
Correction for measurement error in survey research using SQP
600 likes | 750 Vues
Correction for measurement error in survey research using SQP. Willem E. Saris RECSM 2013. Introduction. All researchers agree that survey data contain measurement errors Since 1971 procedures for correction of measurement errors are known (Duncan and Goldberger)

Correction for measurement error in survey research using SQP
E N D
Presentation Transcript
Correction for measurement error in survey researchusing SQP Willem E. Saris RECSM 2013
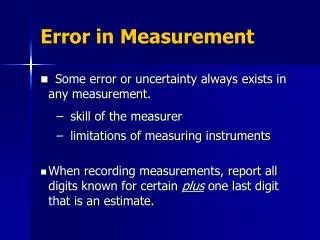
Introduction • All researchers agree that survey data contain measurement errors • Since 1971 procedures for correction of measurement errors are known (Duncan and Goldberger) • However, very few researchers try to correct for these errors
Attention to measurement problems in social science journals of 2011 ESR=The European Sociological Review, EJPR= European Journal of Political Research, POQ= Public Opinion Quarterly, APSR=The American Journal of Political Science , JM=Journal of Marketing
Why does this happen? 1. because the effect of measurement errors is very small? or 2. because it is very difficult to correct for measurement error? or 3. because the information about the size of the measurement errors is not available?
1. Is the effect of the measurement errors very small? • Around 1971, Alwin, Andrews and I detected, using LISREL, that the errors in survey questions are very large • All three have spent their academic life on the estimation and correction for measurement error • Duane Alwin (2007) concentrated on the Quasi Simplex approach • Frank Andrews (1984) and I used the MTMM approach
The size of the error variance • Our estimate was that in average 50% of the variance of responses to survey questions is error • So there is a considerable difference between the variable one likes to measure and the observed variable
Consequences of measurement error • The consequences will discussed for • The observed correlations • The regression analysis • Comparative research
The consequences for the correlation • Imagine that we are interested in the correlation between • f1 = job satisfaction • f2= life satisfaction • We ask : How satisfied are you with your job? and : How satisfied are you with your life? The responses are represented by y1 and y2 We know that there is quite a difference between f1 and y1 and between f2 and y2
A very simple model If the variables fi and yi are standardized • qi2 = the quality of the indicator i for latent variable i • 1- qi2 = the error variance of indicator i for latent variable i • It can be proven that: r(y1y2) = r(f1f2) q1q2
Consequences for correlations • If the correlation between the latent variables is r(f1,f2) = .9, the correlation between the observed variables will be as follows
Consequences for correlations and regressions .6 JS* e1 JS .4 .6 LS* LS e3 .4 Age* e2 Age u3 .99
Consequences for correlations and regressions Correlations between Latent variables Observed variables Regression LS*=.4JS*+.4Age*+u3 LS=.13JS+.24Age+e3
Consequences for cross cultural comparison Country A Country B Corr(Y1,Y2)=.65=.8*.9*.9 Corr(Y1,Y2)=.4=.8*.7*.7
Conclusions • Theresearch of me, Andrews, Alwin and others shows thatthe error variance in survey data isratherlarge • Theerrors cause thatthecorrelations and regressioncoefficientsbetweenobserved variables can beverydifferentfromthosebetweenlatent variables • Differences in error variancesacrosscountrieswillmakecomparisonsacrosscountriesimpossible
Is this the approach to use? • In principle this approach is correct but in reality it leads to a lot of complications and errors • This may be a reason that researchers don´t correct for measurement errors • There should be simpler procedures
2. Is correction for measurement errors very difficult? If this model holds : r(y1y2) = r(f1f2) q1q2 Then it also holds that r(f1f2) = r(y1y2)/ q1q2 So correction for measurement error is very simple This holds for single questions as well as composite scores
Quality estimates of two scales in the last Pilot of the ESS • Two scales were constructed: • one based on opinions about liberal rights called “liberal democracy” and • one based on opinions about electoral requirements called “electoral democracy” • The quality of the scale is: • for liberal demoncracy .79 • for electoral democracy .77
Correction for measurement error • The oberved correlation between the two scales is r(y1y2) = .638 • So r(f1f2) = .638/√(.79x.77) = .82 • So while the observed correlation is not very high, the correlation corrected for measurement error indicates quite a strong relationship between the two scales
Relationships with other variables • We expect that the scale of liberal democracy should correlate with the variables : • Just (no poverty), quality = .51 • Direct (referenda), quality = .62 • Income (houshold), quality = .92 • We will now show how simple we can do regresion analysis with and without correcting for measurement errors
Procedure to correct for measurement error using LISREL Without correction for measurement error Effects on liberal democracy in the UK da ni=4 no=378 ma=km km 1.0 .495 1.0 .401 .413 1.0 .210 -.053 -.116 1.0 labels liberal just direct income model ny=1 nx=3 out Here 1 on the diagonal With correction for measurement error Effects on liberal democracy in the UK da ni=4 no=378 ma=km cm .79 .495 .51 .401 .413 .62 .210 -.053 -.116 .92 labels liberal just direct income model ny=1 nx=3 out Here quality on the diagonal
The correlations and regression Without correction for measurement errors With correction for measurement errors Correlations liberal just direct income -------- -------- -------- -------- liberal 1.00 just 0.78 1.00 direct 0.57 0.73 1.00 income 0.25 -0.08 -0.15 1.00 Regression (70% explained) just direct income -------- -------- -------- liberal 0.76 0.07 0.32 s.e. (0.04) (0.04) (0.03) t-value 18.22 1.59 11.06 Correlations liberal just direct income -------- -------- -------- -------- liberal 1.00 just 0.50 1.00 direct 0.40 0.41 1.00 income 0.21 -0.05 -0.12 1.00 Regression (36% explained) just direct income -------- -------- -------- liberal 0.40 0.27 0.26 s.e. (0.05) (0.05) (0.04) t-value 8.77 5.84 6.29
Generalization • The same can be done for causal models with several variables and composite scores • It can be done for standardized and unstandardized coefficients • STATA has also posibilities for correction for measurement error but less general
Procedure to correct for measurement error using Stata Limitations: • One can apply it only on regression, not on causal models in general • Only correction for measurement error in the independent variables • Only unstandardized analysis
Regression without correction in STATA regress liberal socjustice direct income if cntry==1
The procedure for correction in STATA eivreg liberal socjustice direct income , r(socjustice .51 direct .62 income .92), if cntry==1
Conclusions • Correction for measurement errors is nowadays very simple • Correction for measurement errors is also necessary
3. Is it difficult to estimate the quality of questions and composite scores?
3. Is it difficult to estimate the quality of questions and composite scores? • There are a lot of different procedures • They all require at least 2 questions for each concept and the estimates are specific for the formulations of these questions • That means that the questionnaires become twice as long and more expensive
The Multi-Trait Multi Method approach • There are many procedures developed to obtain estimates of the quality of questions and composite scores (Saris&Gallhofer 2007) • We have chosen the MTMM design • proposed by Campbell and Fiske (1959) • further developed by Andrews (1984), Saris and Andrews (1991), Saris, Satorra and Coenders (2004)
An example Three ESS questions about satisfaction: On the whole, how satisfied are you with the present state of the economy in Britain? Now think about the national government. How satisfied are you with the way it is doing its job? And on the whole, how satisfied are you with the way democracy works in Britain?
Three alternative response scales The first (M1): 1)very satisfied , 2)fairly satisfied, 3)fairly dissatisfied or 4)very dissatisfied The second (M2): very very dissat- satis- isfied fied 0 1 2345 6 78910 The third (M3): 1)not at all satisfied 2)satisfied 3)rather satisfied 4)very satisfied
Estimation • In this way one gets 45 variances and covariances • Using this data the quality coefficients for these 9 questions can be estimated
Limitation of these experiments • In the ESS 3.000 questions have been evaluated with respect to quality up to now • However, in the same time 60.000 questions have been asked • One can never evaluate all questions • So an alternative procedure is necessary
An alternative procedure • Frank Andrews already studied the relationship between the characteristics of the questions and the quality of questions • My idea was that if these relationships are strong one can use them for the prediction of the quality of new questions • I also thought of creating a program that could make these quality predictions
MTMM experimenst in IRMCS1990 - 2000 • 87 MTMM experimentswerecollected in the US (Andrews), theNetherlands (Scherpenzeel), Belgium (Billiet)and Austria (Költringer) containing 1023 questions • A first meta analysiswas done toseeifthequality of thequestionscouldbeexplainedbyquestioncharacteristics • Theresultswereverypromising: theexplainedvariancewas .50 and .60 for thereliability and validity (Saris & Gallhofer 2007)
MTMM experiments in the ESS2000 - 2012 • In the European Social Survey in each round in each country 4 to 6 experiments • Thatmeansthat in each round 1000 questions in more than 20 different European languageswereevaluated • After 3 rounds, wehadinformationaboutthequality of 3.000 questions • Weexpectedtobeabletopredictthequality of thequestionsfromthequestionscharacteristics
The long way to the solution: SQP • We coded the question characteristics of the MTMM questions • Andwe estimated the relationship between these characteristics and the quality of the questions • Without going into details (Oberski et al 2012), we could predict reliability with a R2 =.8 and the validity with a R2=.9 for the present 3.700 MTMM questions • The prediction procedure was implemented in the program SQP 2.0
The quality predictions of SQP 2.0 • So we are quite confident that SQP can make rather good predictions of new questions on the basis of the characteristics of the question
Let us go to have a look Available here: http://sqp.upf.edu/ Can be used free of charge! You just need to register and then you can use it directly online
Conclusions • Itseemsthatitiseasytogetinformationaboutthequality of questions • SQP givesfor a lot of questionsinformationaboutthequalitybasedonresearch • SQP can alsobeusedtopredictthequality of questionsthathavenotbeenstudied • Users can bring in theirownquestions and bycodingthequestionobtain a prediction of thequality • Ifthequalities of single questions are known, thequality of composite scores can alsobederived
Conclusions • The program SQP is an internet application • So all users that are coding questions add information about quality of new questions to the database • In this way,one gets a growing data base of questions with their quality: A wikipedia for questions
Is there any reason not to correct for measurement error ? 1. Is the effect of measurement errors very small? NO! 2. Is it very difficult to correct for measurement error? NO! 3. Is the information about the size of the measurement errors missing? NO!
Conclusions • There is no reason anymore to analyze data without correction for measurement error • If one takes research seriously, one has to make the correction for measurement errors • Otherwise one cannot trust the results from the research
Summary • A summary of all details and problems of this approach using ESS data will be provided in a second edition of • Saris and Gallhofer Design, Evaluation and Analysis of Questionnaires for Survey Research. Hoboken, Wiley • The book will appear in 2014
A very popular topic of research is the explanantion of the opinion about immigration of people from outside Europe Economicthreat Allow more peoplefromoutsideEurope Better life Culturethreat