High Throughput Analysis of Multicomponent Diffusion Data
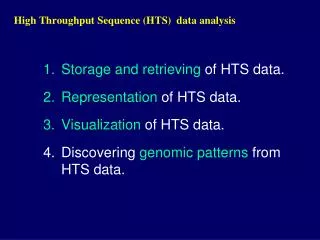
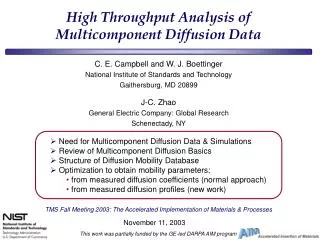
High Throughput Analysis of Multicomponent Diffusion Data. C. E. Campbell and W. J. Boettinger National Institute of Standards and Technology Gaithersburg, MD 20899 J-C. Zhao General Electric Company: Global Research Schenectady, NY. Need for Multicomponent Diffusion Data & Simulations

High Throughput Analysis of Multicomponent Diffusion Data
E N D
Presentation Transcript
High Throughput Analysis of Multicomponent Diffusion Data C. E. Campbell and W. J. Boettinger National Institute of Standards and Technology Gaithersburg, MD 20899 J-C. Zhao General Electric Company: Global Research Schenectady, NY • Need for Multicomponent Diffusion Data & Simulations • Review of Multicomponent Diffusion Basics • Structure of Diffusion Mobility Database • Optimization to obtain mobility parameters: • from measured diffusion coefficients (normal approach) • from measured diffusion profiles (new work) TMS Fall Meeting 2003: The Accelerated Implementation of Materials & Processes November 11, 2003 This work was partially funded by the GE-led DARPA AIM program
Material Models Thermo-Calc DICTRA Precipi-Calc g’ Fast Track Grain size Property Models Yield Strength UTS Creep Fatigue Crack Growth AIM Strategy R88 Ni NiAl W Ta Rapid Experiments Diffusion Multiples g Experiments & Characterization Grain Size Experiments & Characterization
Particle Distribution Mean <R> Primary g’ Temp. profile Volume Fraction Total # Particles/m3 AIM Precipi-Calc simulation of multi-modal g’size distribution for Rene-88 • Validated against GE-Interrupt cooling experiments • GE-AE proprietary data: • Literature data: Mao (2001) • Thermodynamics: Thermo-tech Ni-Data • Diffusion: NIST Ni-mobility database • Thermal profile: DEFORM simulation of blank disk • Assume 3D spherical particle: need to add elastic energy effects • t < 100 s low nucleation rate • 100 s < t < 150 s Primary g’ is formed • 150 s < t < 350 s Primary g’ grows • 400 s Secondary g’ precipitates • 500 s Tertiary g’ precipitates
Multicomponent diffusion matrix for René-88 composition using NIST database René-88 at 1100 °C (x 10-14 m2/s) Simulations need to compute the diffusion matrix for each composition encountered in diffusion profile at each time step. Approach enables efficient data storage Multicomponent Diffusion Review Fick’s first law for Flux, Ji Fick’s second law
Multicomponent Diffusion Database Structure • Inputs: • Calphad Thermodynamics • Diffusion experiments (unary, binary, ternary systems) • Tracer diffusivity, • Intrinsic diffusivity, • Interdiffusion coefficients/Marker motion • Optimize value of mobilities, Mi,for all binaries consistent with available data • Composition and Temperature-dependent • Consistent with estimates of Metastable end members e.g., FCC W • Optimized using code, DICTRA (Parrot) • Add terms if necessary to fit ternary data, etc.
Simulate diffusion process Compare experimental and calculated D Estimate Mobility Adjust Mobility Optimization of Experimental Diffusion Coefficients Experimental diffusion data Calculate diffusion Coefficients D = f(c,T) Mobility M=f (c,T) Ni - Al Diffusion profile Diffusion Coefficient T = 1150 °C Composition Log (Mobility) T = 1050 °C T = 950 °C Distance Composition For a binary:
Ni-Co Interdiffusion Interdiffusionwith Ni Data from Ustad and Sorum, Phys. Stat. Sol. A 285 (1973) 285. Calculated T = 1000 oC 1400 oC Log (D) m2/s 1325 oC Log (D) m2/s 1250 oC 1200 oC 1160 oC Data from Komai et al., Acta. Mater., 46, (1998) 4443. Data from Karunaratne et al., Mater. Sci. Eng., A281 (2000) 229. Atomic Percent Ni Weight Fraction Examples of Optimized Binary InteractionsNi-Al-Cr-Co-Fe-Hf-Nb-Mo-Re-Ta-Ti-W Previous assessments: Ni-Al-Cr Engström and Ågren, Z. Metallkd. 87 (1996) 92. Ni-Al-Ti Matan et al., Acta mater., 46 (1998) 4587. Ni-Cr-Fe Jönsson, Z. Metallkd 85 (7):502-509, 1994. Current assessments: Ni-Co, Ni-Hf,Ni-Mo, Ni-Nb,Ni-Re, Ni-Ta, Ni-Ti, Ni-W Co-Cr, Co-Mo C. E. Campbell, W. J. Boettinger, U. R. Kattner, Acta Mat, 50 (2002) 775
Activation energies in the fcc phase Self activation energies Optimized parameters Optimization of Ni-W Interdiffusion data Data from Monma et. Al., JIM, 28 (1964) 197. Tracer diffusivity data Data from Karuanaratne et al., Mater. Sci&Eng.281 (2000) 229. Data from Monma et. Al., JIM, 28 (1964) 197.
Diffusion Multiple 1 Sample 8 Diffusion Couples R88 IN718 R95 IN100 ME3 R88/R95 R88/IN718 R88/ME3 R88/IN100 R95/IN718 R95/ME3 IN718//IN100 ME3/IN100 Experimental data provides composition and phase fraction profiles as functions of distance. Is it possible to directly relate composition profiles to mobility parameters? Challenge: Analysis of Diffusion Multiples /Multicomponent DiffusionCannot determine diffusion coefficients from experimental data
g g+g g g+g´ René-88 IN-100 g g g R88 g IN100 R88 g g IN100 g René-88 IN-100 Example : René-88/IN-100; 1000 h at 1150 °C • At 1150 °C equilibrium • phase fractions • René-88: fg = 1 • IN-100: fg = 0.638 fg’ = 0.362 Additional g+g’ GE couples analyzed: René-95/ René-88 ME3/IN718 IN100/ME3 U720/IN718 IN100/ René-88 René-95/U720 IN718/IN100 U720/ME3 René-95/IN718 ME3/ René-95 ME3/ René-88 IN100/U720 Experimental data from J. C. Zhao, GE-GR, Schenectady, NY
Diffusion Mobility Database Run DICTRA (via python) Thermodynamic Database Compare composition profiles Change Mi and z0, Run new simulation Input Experimental File (Composition Profiles) Calculate Error (via Mathematica) Minimize Error f(Mi) Diffusion Database Optimization Scheme
Test Example: Binary Ni-Co Interdiffusion Coefficient obtained by Boltzmann-Matano method
Shift Matano interface Programming Elements and Inputs • Error Definition: • Wi(z)= Weighting function • Currently set to equal 1 • z0 = Error associated with location of Matano plane a b • Change selected mobility parameters
Initial Parameters Initial Optimized Optimized Parameters Distance shift z0= -1.58 mm Ni-Co: Optimization Results
Initial Parameters NIST MOB - Initial Optimized Optimized Parameters GE Experimental data BM analysis Distance shift z0= -1.58 mm Optimization Results: Diffusion Coefficient
Ternary Example:Ni-5.13Al-9.77Cr/Ni-2.39Al-19.34Cr (at.%) For a single couple cannot determine the interdiffusion coefficients using the BM method T = 1100 °C t = 1000 h T = 1100 °C t = 1000 h Reference Reference Binary interactions zeroed Binary interactions zeroed
Diffusion Database Optimization Scheme Diffusion Mobility Database Run DICTRA (via python) Thermodynamic Database Compare composition profiles Change MiRun new simulation Input Experimental File (Composition Profiles) Calculate Error (via Mathematica) 1 couple 2 profiles Minimize Error f(Mi) Changing 9 binary interactions
Optimized AlAlCr= 341099 CrAlCr= 397756 NiAlCr=265578 AlAlNi= -175812 CrAlNi=-117332 NiAlNi=-24037 AlCrNi= -58013 CrCrNi=-62614 NiCrNi=-89378 Optimization Results: 9 parameters T = 1100 °C t = 1000 h T = 1100 °C t = 1000 h Reference AlAlCr=335000 CrAlCr= 487000 NiAlCr=211000 AlAlNi=-166517 CrAlNi=-118000 NiAlNi=-23068 AlCrNi=-53200 CrCrNi=-68000 NiCrNi=-81000 Binary Interactions zero
Goal: Ni/Rene-88 • Optimization strategy • Ni end-member term • Ti, Nb • Ni binary interactions • Ni-Ti Ni-Nb • Ni-Cr Ni-Al • Ni ternary interactions • Ni-Al-Cr • Ni-Al-Ti • Ni-Cr-Nb
Diffusion Mobility Database Run DICTRA (via python) Thermodynamic Database Compare composition profiles Change Mi and z0, Run new simulation Input Experimental File (Composition Profiles) Calculate Error (via Mathematica) Minimize Error f(Mi) Diffusion Database Optimization Scheme 1 couple 7 profiles Changing 2 binary end members 2 binary interactions
Initial Ni-MOB = -386325 =-81000 =-367650 =-68000 Optimized = -367867 =-93125 =-327697 =-70015 z0= +7.5 mm Experiment 4 parameters optimized Initial Ni-MOB • Need to consider additional parameters: • Other binary interactions • Ternary interactions Ti Profile from Ni/Rene-88
Summary • Multicomponent Ni-base diffusion mobility • Based on optimization of available diffusion coefficient data • Comparison of simulation results with experiments shows good agreement • Optimization based on composition profiles • Method • Relates profiles to mobility parameters • Provides ability to asses error associated with mobility parameters • Examples • Binary: Ni-Co (1 couple, fixed T,1 profile, 4 parameters, z0) • Ternary: Ni-Al-Cr (1 couple, fixed T, 2 profiles, 9 parameters) • Multicomponent: Ni/Rene88 (1 couples, fixed T, 7 profiles, 4 parameters, z0) • Improved optimization strategy needed • Multicomponent single phase (Need to consider more than 1 couple) • Multicomponent multiphase • Programming additions needed • Weighting functions • Other error definitions


![High-Throughput Analysis of Genomic Data [S7] E NRIQUE B LANCO](https://cdn2.slideserve.com/3859222/high-throughput-analysis-of-genomic-data-s7-e-nrique-b-lanco-dt.jpg)


![High-Throughput Analysis of Genomic Data [S6] E NRIQUE B LANCO](https://cdn2.slideserve.com/5183805/high-throughput-analysis-of-genomic-data-s6-e-nrique-b-lanco-dt.jpg)


![High-Throughput Analysis of Genomic Data [S3] E NRIQUE B LANCO](https://cdn3.slideserve.com/6315933/high-throughput-analysis-of-genomic-data-s3-e-nrique-b-lanco-dt.jpg)