Linkage Between Production and Respiration in Louisiana Shelf Hypoxia Study
10 likes | 120 Vues
Explore the relationship between productivity and hypoxia severity in Louisiana's continental shelf. Salinity and oxygen data reveal varying metabolic rates. Results aim to enhance hypoxia predictions for better nutrient management.

Linkage Between Production and Respiration in Louisiana Shelf Hypoxia Study
E N D
Presentation Transcript
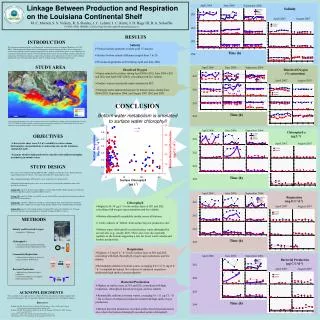
April 2006 April 2006 April 2006 April 2006 April 2006 June 2006 June 2006 June 2006 June 2006 June 2006 September 2006 September 2006 September 2006 September 2006 September 2006 Z01 Z01 Z01 Z01 Z01 April 2007 April 2007 April 2007 April 2007 April 2007 August 2007 August 2007 August 2007 August 2007 August 2007 Z02 Z02 Z02 Z02 Z02 Z03 Z03 Z03 Z03 Z03 Initial DO Time (h) Time (h) Time (h) Time (h) Time (h) Z04 Z04 Z04 Z04 Z04 STUDY AREA Map showing the sampling sites in the Louisiana coastal zone. The distribution of surface water chlorophyll (µg L-1) from July 2007 (MODIS satellite estimate) is included as typical of summer conditions. The hatch denotes the region where hypoxia is observed during summer. The 20 m contour is included. Final DO Z03 Z04 Z01 Z02 METHODS Salinity and Dissolved Oxygen • Seabird 911 CTD/Rosette Chlorophyll a • Filtered and measured fluorometrically on methanol extracts (Welschmeyer 1994) 24 hr Community Respiration • Measured rate of change in dissolved oxygen in 300 ml BOD bottles 1 hr Bacterial Production • Measured rate of bacterial carbon production • 3H L-leucine uptake in 1 ml samples (Smith and Azam 1992) Linkage Between Production and Respiration on the Louisiana Continental Shelf Salinity M. C. Murrell, S. S. Vickery, R. S. Stanley, J. C. Lehrter, J. C. Kurtz, J. D. Hagy III, B. A. Schaeffer US EPA, ORD, NHEERL, Gulf Ecology Division (murrell.michael@epa.gov) RESULTS INTRODUCTION The Louisiana continental shelf is well-known for an annual occurrence of hypoxia (Rabalais et al. 1999, 2007). Understanding the linkage between anthropogenic nutrient loading and the severity of hypoxia is critical to developing sensible nutrient management. The work described on this poster is one component of a multi-investigator project aimed at better predicting whether future nutrient loading scenarios will alter the summertime development of hypoxia. Apart from providing a rich empirical dataset, these results will help parameterize and constrain biogeochemical models, leading to improved hypoxia predictions. • Salinity • Vertical salinity gradients evident at all 15 stations • Surface bottom salinity difference ranged from 3 to 20 • Pronounced gradients at Z01 during April and June 2006 • Dissolved Oxygen • Super-saturated in surface during April 2006 (Z01), June 2006 ( Z01 and Z02) and April 2007 (Z04), coinciding with low salinity. • Surface waters consistently under-saturated at Z03. • Strongly under-saturated (hypoxic) in bottom waters during June 2006 (Z02), September 2006, and August 2007 (Z02 and Z03). Dissolved Oxygen (% saturation) CONCLUSION Bottom water metabolism is unrelated to surface water chlorophyll Chlorophyll a (µg L-1) • OBJECTIVES • Characterize short term (1-2 d) variability in water column hydrography and metabolism at contrasting sites on the Louisiana continental shelf • Examine whether high productivity coincides with high heterotrophic metabolism in bottom waters • STUDY DESIGN • Five cruises were conducted during 2006 and 2007, sampling 3 stations per cruise. Each station was sampled intensively for 30-36 h. All stations fall within the summer hypoxic zone. • Water column hydrography (CTD profiles) were conducted at 3-6 hour intervals. • Chlorophyll and metabolic process rates were measured at several depths (minimum surface and bottom) at 6 h intervals. • Station Z01: (aka A'4). In the Louisiana Bight at a water depth of 20 m. Highly productive region near the Mississippi River plume sampled in 2006 (3 cruises). • Station Z02: (aka C6). 90 km west of Z01 at water depth of 20 m. Generally lower freshwater influence than Z01 but still productive. • Station Z03: (aka H4). 190 km west of Z02 at a water depth of 20 m. Generally lowest freshwater influence and lowest productivity (despite being directly offshore of the Atchafalaya River outflow). • Station Z04: (aka C2) 17 km north (inshore) of station Z02 with a water depth of 8 m.. Stronger freshwater influence and more productive than Z02. Sampled in 2007 (2 cruises) Respiration (mg O L-1d-1) • Chlorophyll • Highest (20–30 µg L-1) in the surface layer at Z01 and Z02, coinciding with oxygen super-saturation and low salinity • Bottom chlorophyll remarkably similar across all stations • Little evidence of ‘fallout’ from surface layer at productive sites • Bottom water chlorophyll exceeded surface water chlorophyll at several sites (e.g., mostly Z03). These sites were also typically euphotic to the bottom suggesting a role for lower water column and benthic productivity. • Respiration • Highest (1-2 mg O L-1 d-1) in the surface layer at Z01 and Z02, coinciding with high chlorophyll, oxygen super-saturation, and low salinity. • Remarkably uniform in bottom waters, averaging 0.23 ± 0.11 mg O L-1 d-1 (±standard deviation). No evidence of enhanced respiration underneath high surface layer production. Bacterial Production (µg C L-1d-1) • Bacterial Production • Highest in surface layer at Z01 and Z02, coinciding with high respiration, chlorophyll, dissolved oxygen, and low salinity. • Remarkably uniform in bottom waters, averaging 16 ± 11 µg C L-1 d-1. No evidence of enhanced production underneath high surface layer production. • Bottom bacterial production exceeded surface bacterial production at sites where the bottom chlorophyll exceeded surface chlorophyll. ACKNOWLEDGMENTS We are grateful to the captain and crew of the OSV Bold, and numerous technical support staff involved in this project. We are especially indebted to George Craven for chlorophyll analyses. References Rabalais NN, RE Turner, D Justić, Q Dortch, WJ Wiseman, Jr 1999. CENR Topic 1 Report, NOAA Coastal Ocean Program, Silver Spring, MD Rabalais NN, RE Turner, BK Sen Gupta, DF Boesch, P Chapman, MC Murrell. 2007. Estuaries and Coasts 30:753-772. Smith DC, F Azam. 1992. Marine Microbial Food Webs 6:107-114. Welschmeyer NA. 1994. Limnology & Oceanography 39:1985-1992.