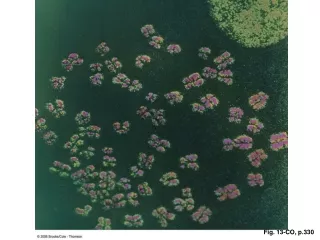
Fig. 13-CO, p. 347
720 likes | 869 Vues
Fig. 13-CO, p. 347. Fig. 13-1, p. 348. Fig. 13-2, p. 349. Sunlight. Chlorophyll. Produces. Glucose (C 6 H 12 O 6 ). 6 Oxygen (O 2 ). 6 Carbon dioxide (CO 2 ). +. +. 6 Water (H 2 O). Fig. 13-2, p. 349. Sunlight. Chlorophyll. Produces. Glucose (C 6 H 12 O 6 ). 6 Oxygen (O 2 ).

Fig. 13-CO, p. 347
E N D
Presentation Transcript
Sunlight Chlorophyll Produces Glucose (C6H12O6) 6 Oxygen (O2) 6 Carbon dioxide (CO2) + + 6 Water (H2O) Fig. 13-2, p. 349
Sunlight Chlorophyll Produces Glucose (C6H12O6) 6 Oxygen (O2) 6 Carbon dioxide (CO2) + + 6 Water (H2O) Stepped Art Fig. 13-2, p. 349
Sun Light energy Producers Photosynthesizers: Green plants and algae, and specialized bacteria Chemical energy (carbohydrates, etc.) Consumers Respirers: Animals and decomposers and plants at night Energy of movement, waste heat, entropy To space Fig. 13-3, p. 350
Sun Light energy Photosynthesizers: Green plants and algae, and specialized bacteria Chemical energy (carbohydrates, etc.) Respirers: Animals and decomposers and plants at night Energy of movement, waste heat, entropy Producers Consumers To space Stepped Art Fig. 13-3, p. 350
24 Hydrogen sulfide (H2S) 6 Carbon dioxide (CO2) + + 6 Oxygen (O2) Glucose (C6H12O6) 18 Water (H2O) + 24 sulfur (S) + Fig. 13-4, p. 350
24 Hydrogen sulfide (H2S) 6 Carbon dioxide (CO2) + + 6 Oxygen (O2) Glucose (C6H12O6) 18 Water (H2O) + 24 sulfur (S) + Stepped Art Fig. 13-4, p. 350
1 meter 1 meter CO2 Carbon dioxide C6H12O6 Glucose Diatom Typically, oceanic primary productivity in this water column will bind ~120 grams of carbon into molecules of glucose each year. to bottom of ocean a Fig. 13-5a, p. 351
LOW HIGH Fig. 13-6b, p. 352
Trophic Level A tuna sandwich 100 g (1/4 pound) Tuna (top consumers) 5 For each kilogram of tuna, roughly 10 kilograms of mid- size fish must be consumed, Midsize fishes (consumers) 4 Small fishes and larvae (consumers) and 100 kilograms of small fish, 3 and 1,000 kilograms of small herbivores, 2 Zooplankton (primary consumers) 1 and 10,000 kilograms of primary producers. Phytoplankton (primary producers) Fig. 13-8, p. 354
Fifth level top carnivore Killer Whales Fourth level consumers Seals Third level consumers Sperm whale Penguins Birds Baleen whales Second level consumers Pelagic fishes Carnivorous zooplankton Squid Demersal fishes Primary consumers Protozoans Krill Copepods Benthic invertebrates Primary producers Detritus Microplankton Macroalgae Bacteria Fig. 13-9, p. 355
CO2 in atmosphere to plants for photosynthesis CO2 in the atmosphere Precipitation Respiration Dissolved CO2 Decomposers Limestone Plant residues CO2 is taken up by phytoplankton for photosynthesis Peat coal Dissolved CO2 forms HCO3– Decomposition Shells Sediments Limestone Fig. 13-10, p. 357
Atmospheric nitrogen Nitrogen fixation by bacteria Nitrogen cycling within the photic zone Runoff Photic zone Producers incorporate nitrogen into amino acids Runoff: fertilizers, nitrates, plant material Nutrient upwelling Nutrient settling Fig. 13-11, p. 358
Mining Fertilizers Excretion Guano Agriculture Weathering Uptake by autotrophs Uptake by autotrophs Land food webs Marine food webs Dissolved in soil water, lakes, rivers Leaching, runoff Dissolved in ocean water Death, decomposition Death, decomposition Sedimentation Settling out Weathering Uplifting over geologic time Rocks Marine sediments Fig. 13-12, p. 358
Limiting Factors 90°N Light Silicon Phosphorous 45°N Nitrogen Fe (Iron) 0° 45°S 90°S 90°W 0° 90°E 180° 180° Fig. 13-13, p. 360
Wavelength (nanometers) 400 500 600 700 Sea surface Increasing depth Photic zone Approximately 600 m (2,000 ft) Aphotic zone a Clear, open ocean water Fig. 13-14a, p. 361
Wavelength (nanometers) Sea surface 500 400 600 700 Photic zone Approximately 100 m (330 ft) Aphotic zone b Coastal ocean water Fig. 13-14b, p. 361
Depth Enough sunlight for: 0 m Photosynthesis and vision Euphotic zone to ~70 meters (230 feet) 100 m 200 m 300 m Vision only—Not enough sunlight for photosynthesis Disphotic zone to ~600 meters (2,000 feet) 400 m 500 m 600 m Aphotic zone below 600 meters (2,000 feet) No sunlight Fig. 13-15, p. 361
°F °C 105 40 Daytime temperatures in some shallow tropical lagoons 100 35 95 90 30 Highest surface temperatures in open ocean 85 80 25 Common surface temperatures in tropical waters 75 20 70 Common surface temperatures in subtropical waters 65 60 15 Common surface temperatures in temperate waters 55 10 50 Common surface temperatures in high-latitude temperate waters 45 5 Surface temperatures in low Arctic and Antarctic waters in summer 40 35 0 Surface temperatures of high Arctic and Antarctic waters all year (seawater freezes at –1.9°C) 30 25 Temperature at depths of deepest Antarctic basins –5 Fig. 13-16, p. 362
Water Dye cube Day 1 Day 2 Day 5 Day 20 Fig. 13-17, p. 364
Water Dye cube Day 1 Day 2 Day 5 Day 20 Stepped Art Fig. 13-17, p. 364
Cell membrane Cell membrane Cell membrane Outside the cell Inside the cell Inside the cell Outside the cell Inside the cell Outside the cell No net water movement Net water movement out of the cell Net water movement into the cell Fig. 13-18 (top), p. 365
Hypertonic (water diffuses outward, cells shrivel) Isotonic (no net change in water movement or in shapes of cells) Hypotonic (water diffuses inward, cells swell up) Fig. 13-18 (bottom), p. 365
a Diffusion Fig. 13-19a, p. 366
b Osmosis Fig. 13-19b, p. 366