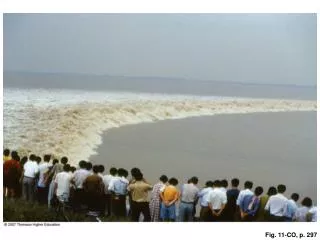
Fig. 4-CO, p. 97
730 likes | 893 Vues
Fig. 4-CO, p. 97. Fig. 4-1, p. 99. Fig. 4-2a, p. 100. Beam of sound waves travels to bottom and is reflected back to ship. Depth = V ( T /2). Fig. 4-2a, p. 100. Fig. 4-2b, p. 100. Measured depth is less than actual depth. Sound beam emitted by

Fig. 4-CO, p. 97
E N D
Presentation Transcript
Beam of sound waves travels to bottom and is reflected back to ship Depth = V (T/2) Fig. 4-2a, p. 100
Measured depth is less than actual depth Sound beam emitted by echo sounder (beam angle is exaggerated) equals true depth Measured depth beneath vessel True depth immediately Seafloor Fig. 4-2b, p. 100
500 1,000 1,500 Depth (m) 2,000 −200 −400 X (m) 2,500 −600 −800 3,000 −5,000 −5,500 −6,000 Y (m) Box 4-1b, p. 103
49 46.5 49 46.0 Latitude 49 45.5 −130 −130 −130 −130 −16.5 −16.0 −15.5 −15.0 Longitude Box 4-1c, p. 103
Geosat Orbit h Sea Surface Ocean Seafloor Crust Fig. 4-5b, p. 104
Height in meters Height in feet Sierra Nevada Rocky Mountains 4,572 15,000 Appalachian Mountains 3,048 10,000 1,524 5,000 0 0 –1,524 –5,000 –10,000 –3,048 –15,000 –4,572 Atlantic Ridge Africa South America –20,000 –6,096 0 100 200 300 400 500 Horizontal scale in nautical miles Depth in feet 0 200 400 600 800 926 Depth in meters Horizontal scale in kilometers Vertical x 100 Fig. 4-6b, p. 105
Earth’s area (hundreds of millions of square kilometers) Mount Everest 8.85 km (5.5 mi) Elevation (kilometers) Elevation (miles) Mean land elevation 840 m (2,760 ft) Sea level Mean depth of sea 3,796 m (12,451 ft) Depth (miles) Depth (kilometers) Mariana Trench ~11 km % Earth’s area at this elevation or higher Fig. 4-7, p. 105
Deep-ocean basin Continental margin Continental margin Submarine canyon profile (cut through continental shelf) Sediment Continental shelf Continental slope Oceanic ridge Sediment Continental rise Continental crust (granitic) Continental crust (granitic) Oceanic crust (basaltic) Oceanic crust (basaltic) Asthenosphere Fig. 4-8, p. 106
Continental mountains 10.3% Ocean 70.8% Land 29.2% Oceanic ridges 22.1% Continental lowlands 18.9% Continental shelves and slopes 11.4% Ocean basin floors 29.8% Volcanic island arcs, trenches, submarine volcanoes, and hills 3.7% Continental rise 3.8% Oceanic crust Continental crust Fig. 4-9, p. 106
Narrow continental shelf An active margin A passive margin Peru–Chile Trench Plate boundary Andes Mountains Plate boundary Broad continental shelf South America Atlantic Ocean Pacific Ocean South American Plate Deep basin Nazca Plate African Plate Plate movement Plate movement Plate movement Subduction zone (deep and shallow earthquakes) Mid-Atlantic Ridge (spreading centers, shallow earthquakes) Fig. 4-10, p. 107
Distance from shore (miles) 0 100 200 300 400 500 600 700 Continental margin Continental shelf Sea level 0 0 Shelf break (~140 m, 460 ft) 1 Continental rise 1 Depth (km) (sediment thickness varies) Depth (miles) 2 3 2 Continental slope 4 Deep-ocean floor 3 5 0 100 200 300 400 500 600 700 800 900 1,000 1,100 1,200 Vertical exaggeration 50:1. Distance from shore (km) Sea level 0 Depth (km) 4 0 100 200 300 400 500 600 700 800 900 1,000 1,100 1,200 No vertical exaggeration. Fig. 4-11, p. 108
Today’s sea level 0 0 Height above or below present sea level (m) Height above or below present sea level (ft) –426 –130 0 50,000 100,000 150,000 200,000 250,000 Years before present Fig. 4-15, p. 110
Canyon heads Shelf break Continental shelf Deep-sea fan Continental slope Distribution channel Fig. 4-16, p. 111
Feet Meters 4,390 14,400 15,000 4,570 0 1 2 3 4 5 Miles 15,600 4,760 1 2 3 4 5 6 Kilometers Depth Fig. 4-20, p. 112
Mid-Atlantic Ridge Juan de Fuca Ridge 2.6 East Pacific Rise (Ridge) 3.8 5.5 15.7 2.8 10.7 9.5 9.5 Indian Ridge 6.4 6.4 1.5 Pacific–Antarctic Ridge Fig. 4-21a, p. 114