
Uploaded by
felix-noble
1 SLIDES
109 VUES
10LIKES
Analysis of Flexible Fund Obligations as a Percentage of Total Obligations in Selected States, FY 1992-2004
DESCRIPTION
This study examines the trends in flexible fund obligations compared to total obligations in states with a minimum of 10% flexible fund obligations. Data spans fiscal years 1992 to 2004. Explore how states handle their financial commitments and prioritize flexible funds.
Download
1 / 1
Télécharger la présentation 
Analysis of Flexible Fund Obligations as a Percentage of Total Obligations in Selected States, FY 1992-2004
An Image/Link below is provided (as is) to download presentation
Download Policy: Content on the Website is provided to you AS IS for your information and personal use and may not be sold / licensed / shared on other websites without getting consent from its author.
Content is provided to you AS IS for your information and personal use only.
Download presentation by click this link.
While downloading, if for some reason you are not able to download a presentation, the publisher may have deleted the file from their server.
During download, if you can't get a presentation, the file might be deleted by the publisher.
E N D
Presentation Transcript
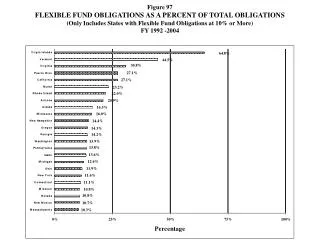
Figure 97FLEXIBLE FUND OBLIGATIONS AS A PERCENT OF TOTAL OBLIGATIONS(Only Includes States with Flexible Fund Obligations at 10% or More)FY 1992 -2004


More Related