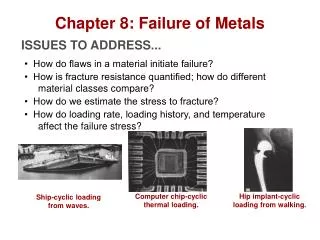
Chapter 8 Failure Analysis and Prevention
Chapter 8 Failure Analysis and Prevention. Introduction :. All the engineering materials may fail by the effect of environments during use. At RT, metals and polymers stressed beyond their elastic limit, eventually fract-ure following a period of nonlinear plastic deformation.

Chapter 8 Failure Analysis and Prevention
E N D
Presentation Transcript
Introduction: All the engineering materials may fail by the effect of environments during use. At RT, metals and polymers stressed beyond their elastic limit, eventually fract-ure following a period of nonlinear plastic deformation. Brittle ceramics and glasses typically break following elastic deformation only. The inherent brittleness of ceramics and glasses combined with their common use at high temp. make thermal shock a major concern. With continuous service at relatively high temp., any engineering material can fracture when creep deformation reaches its limit. In this chapter, the following concepts will be studied. 1). Impact energy, 2). Ductile-brittle transition temperature, 3) Fatigue, 4). Nondestructive testing, 5). Failure analysis, 6). Failure prevention.
8.1 Impact Energy Impact energy, the energy necessary to fracture a standard test piece under an impact load, is a similar analog of toughness. Notch for the stress concentration Figure 8.1Charpy test of impact energy. (From H. W. Hayden, W. G. Moffatt, and J. Wulff, The Structure and Properties of Materials, Vol. 3: Mechanical Behavior, John Wiley & Sons, Inc., New York, 1965.) The principle of Charpy test : The energy necessary to fracture the specimen is directly calculated from the difference in initial and final heights of the swinging pendulum. The impact energy correlates with the area under the total stress-strain curve of the tensile test of the given material. However, in case of tensile test, depends on the strain rate, the area may change. Most common impact tester
Another impact test? How do you calculate the impact energy?
History of Charpy and Izod Pendulum Impact Test During the first part of the 20th century, a metallurgist named Izod invented an impact test for determining the suitability of various metals to be used as cutting tools and plastics. The test involved a pendulum with a known weight at the end of its arm swinging down and striking the specimen as it stood clamped in a vertical position. Some years later another metallurgist named Charpy modified the test slightly by orienting the specimen in a horizontal fashion. These pendulum impact test methods proved to be very useful, providing reliable, qualitative impact data throughout WWII up until the early 70's. It then became apparent that higher velocities and impact energies could be achieved with vertical style drop towers and thus the trend began to shift.
Testing Method and Specimens for Charpy and Izod Testing While still used, pendulum impact testing has inherent weaknesses. In notched Izod testing, samples are mounted in a vise fixture with the notch facing a pendulum. A weighted pendulum, fixed at a point directly above the sample vise, is swung up and held stationary. This height and thus the speed of the pendulum at impact is a constant for this test. When released, the pendulum swings through the path where the sample is fixed. As the sample breaks, energy is absorbed by the sample. The height the pendulum attains after impact is measured by an indicator on a fixed scale which reads in joules (ft-lb). The impact strength is the loss of momentum in the pendulum while breaking the sample off at the notch. The Izod pendulum test configuration served as the standard in impact testing in the plastics and metals industry for many years.
In general, the alloys with high strength (YS & UTS) and ductility (%εfracture) are considered to have large-impact fracture energy.
In the Charpy test, the test piece is held horizontally between two vertical bars, much like the lintel over a door. In the Izod test, the specimen stands erect, like a fence post. See also testing machine. Izod test specimens vary depending on what material is being tested. Metallic samples tend to be square in cross section, while polymeric test specimens are often rectangular, being struck parallel to the long axis of the rectangle.
In general, FCC metals have high impact energy. However, HCP metals have low impact energy in the same temperature range. BCC metals, show ductile-brittle transition phenonenon. (See next figure) Figure 8.2Impact energy for a ductile fcc alloy (copper C23000–061, “red brass”) is generally high over a wide temperature range. Conversely, the impact energy for a brittle hcp alloy (magnesium AM100A) is generally low over the same range. (From Metals Handbook, 9th ed., Vol. 2, American Society for Metals, Metals Park, OH, 1979.) (FCC) (HCP)
In BCC Metals : Ductile-Brittle Transition Temperature (DBTT) exist. This is because of the fact that in BCC, disl-ocations slip on less compact slip planes. Therefore, dis-ocation motion becomes more difficult with added alloying elements to limit the ductility of the alloy. Below DBTT, very susceptible to catastrophic failure. Remember Titanic! plain-carbon steels x Figure 8.3Variation in ductile-to-brittle transition temperature with alloy composition. (a) Charpy V-notch impact energy with temperature for plain-carbon steels with various carbon levels (in weight percent). (b) Charpy V-notch impact energy with temperature for Fe–Mn–0.05C alloys with various manganese levels (in weight percent). (From Metals Handbook, 9th ed., Vol. 1, American Society for Metals, Metals Park, OH, 1978.) x x x x x As C↑, Eimpact ↓, DBTT ↓ → High C-steel has very low impact energy over 50oC temperature range. Fe–Mn–0.05C alloys As Mn ↑, Eimpact ↑, DBTT ↑
cleavage texture of a brittle fracture surface Fracture originates near the center and spreads outward with a dimpled texture. Near the surface, the stress state changes from tension to shear, with fracture continuing at approximately 45°. Figure 8.4(a) Typical “cup and cone” ductile fracture surface. Fracture originates near the center and spreads outward with a dimpled texture. Near the surface, the stress state changes from tension to shear, with fracture continuing at approximately 45°. (b) Typical cleavage texture of a brittle fracture surface. “cup and cone” ductile fracture surface Explain the origin of the cup and cone.
Examples and Practice Problems : Students are asked to review the “Example” of 8.1 and solve the “Practice Problem” of 8.1 in the text.
8.2 Fracture Toughness σ Fracture mechanics, “general analysis of failure of structures with preexisting flaws”, became very important subject after the serious many failures of the “Liberty Ship” during WWII. Figure 8.5Fracturetoughness test. t Fracture toughness is the most widely used param-eter from fracture mechanics, and is expressed, KIC, which is the critical value of the stress intensity factor at a crack tip necessary to produce catastrophic failure under simple uniaxial loading. KIC =Yσf √πα(unit : MPa√m)(8.1) Explain the use of this equation for design! KIC is for plane strain condition, [ t ≥ 2.5(KIC /YS )2]. For thin specimen in plane stress condition, the toughness is express as KC . σf : overall applied stress at failure Y: dimensionless geometry factor on order of 1 Compact test specimen for fracture toughness measurement
MPa√m TABLE 8.3 (continued) KIC values for these materials are very small compared to metals, because they can not have plastic deformation.
Figure 8.6A design plot of stress versus flaw size for a pressure-vessel material in which general yielding occurs for flaw sizes less than a critical size, ɑcritical, but catastrophic fast fracture occurs for flaws larger than ɑcritical. : For a given KIC (Taking Y = 1.)
Figure 8.7Two mechanisms for improving fracture toughness of ceramics by crack arrest. (a) Transformation toughening of partially stabilized zirconia involves the stress-induced transformation of tetragonal grains to the monoclinic structure, which has a larger specific volume. The result is a local volume expansion at the crack tip, squeezing the crack shut and producing a residual compressive stress. (b) Microcracks produced during fabrication of the ceramic can blunt the advancing crack tip. Transformation toughening Utilizing microcracks
Examples and Practice Problems : Students are asked to review the “Example” of 8.2 and 8.3 and solve the “Practice Problem” of 8.2 and 8.3 in the text.
8.3 Fatigue In practice, many engineering materials are experiencing cyclic stress rather than static loading. Under the cyclic stressing, a special problem is arising, called “fatigue”, which is the general phenomenon of material’s brittle failure after several cycles of loading to a stress level below UTS. Metal fatigue is defined as a loss of strength created by microstructural damage generated during cyclic loading. Fatigue failure could also be a catastrophic failure, which brings the loss of human lives and properties. Figure 8.8Fatigue corresponds to the brittle fracture of an alloy after a total of N cycles to a stress below the tensile strength.
A typical rotary-bending fatigue testing machine Figure 8.9Fatigue test. (From C. A. Keyser, Materials Science in Engineering , 4th ed., Charles E. Merrill Publishing Company, Columbus, OH, 1986.) During rotation, in every cycle, the specimen is experiencing tensile (bottom) and compressive (top) stress repeatedly.
As S decreases, N increases. Figure 8.10Typical fatigue curve (S-N curve). (Note that a log scale is required for the horizontal axis.) For ferrous metals Non-ferrous metals do not have the strait endurance limit, but it is gradually decreasing. In this case 108 is taken as the limit. (See Fig. 8.15)
Figure 8.11An illustration of how repeated stress applications can generate localized plastic deformation at the alloy surface leading eventually to sharp discontinuities. : acts as the surface crack ; fatigue crack starts.
Figure 8.12Illustration of crack growth with number of stress cycles, N, at two different stress levels. Note that, at a given stress level, the crack growth rate, dɑ/dN, increases with increasing crack length, and, for a given crack length such as ɑ1, the rate of crack growth is significantly increased with increasing magnitude of stress.
X ∆K = Kmax –Kmin =Y∆σ√πα = Y(σmax – σmin)√πα (8.3) Figure 8.13Illustration of the logarithmic relationship between crack growth rate, da/dN, and the stress intensity factor range, ΔK. Region I corresponds to nonpropagating fatigue cracks. Region II corresponds to a linear relationship between log dɑ/dN and log ΔK. Region III represents unstable crack growth prior to catastrophic failure. K has the more general meaning of “stress intensity factor”and KIC is the specific values of K, i.e., fracture toughness. (dα/dn) = A (∆K)m (8.2) This linear relation is obtained by the concept of fracture mechanics. For different materials, they can be compared with the values of (dα/dn) for comparison of their fatigue properties. No crack growing range Accelerat-ed crack growing region
Figure 8.14Characteristic fatigue fracture surface. (a) Photograph of an aircraft throttle-control spring 1-1/2 that broke in fatigue after 274 h of service. The alloy is 17–7PH stainless steel. (b) Optical micrograph (10) of the fracture origin (arrow) and the adjacent smooth region containing a concentric line pattern as a record of cyclic crack growth (an extension of the surface discontinuity shown in Figure 8.11). The granular region identifies the rapid crack propagation at the time of failure. (c) Scanning electron micrograph (60), showing a closeup of the fracture origin (arrow) and adjacent “clamshell” pattern. (From Metals Handbook, 8th ed., Vol. 9: Fractography and Atlas of Fractographs, American Society for Metals, Metals Park, OH, 1974.) Broken region
As it has been explained in Fig. 8.10, the ferrous alloys have the “fatigue limit” or “endurance limit” as shown in Fig.8.15(a) Figure 8.15Comparison of fatigue curves for (a) ferrous and (b) nonferrous alloys. The ferrous alloy is a ductile iron. The nonferrous alloy is C11000 copper wire. The nonferrous data do not show a distinct endurance limit, but the failure stress at N = 108 cycles is a comparable parameter. (After Metals Handbook, 9th ed., Vols. 1 and 2, American Society for Metals, Metals Park, OH, 1978, 1979.) On the other hand, for non-ferrous alloys, there is no such a distinct fatigue limit, rather the fatigue strength is decreasing continuously. Fatigue limit is defined to be N=108 for the non-ferrous alloys.
Fatigue strength of the alloys usually falls between ¼ and ½ of the tensile strength.
Plotting the data in Table 8.4, one can obtain the results shown in this figure. As it was mentioned, it shows that F.S. falls between ¼ and ½ of the T.S. → Higher the TS, stronger the FS to give longer fatigue life. Figure 8.16Plot of data from Table 8.4 showing how fatigue strength is generally one-fourth to one-half of the tensile strength.
→ Increases fatigue life Figure 8.17Fatigue strength is increased by prior mechanical deformation or reduction of structural discontinuities. 1). Cold work : Due to the strain hardening, tensile strength is increased. 2). Surface smoothness : Smoothening the surface, surface roughness is disappeared to eliminate fatigue initiation sites.
Fatigue also occurs in ceramics and glasses, but without cyclic loading. Figure 8.18The drop in strength of glasses with duration of load (and without cyclic-load applications) is termed static fatigue. (From W. D. Kingery, Introduction to Ceramics, John Wiley & Sons, Inc., New York, 1960.) The reason is that a chem-ical rather than mechanical mechanism is involved ; 1). It occurs in water environment and 2). at room temperature. Next slides
Figure 8.19The role of H2O in static fatigue depends on its reaction with the silicate network. One H2O molecule and one –Si– O–Si– segment generate two Si–OH units, which is equivalent to a break in the network because the hydroxyl units are not bonded to each other, leaving a break in the silicate network.When this reaction occurs at the tip of a surface crack, the crack is lengthened by one atomic-scale step. In the temp. range above 150oC, the hydroxyl reaction is so fast that the effects are difficult to monitor, and in this T range, other factors such as viscous deformation can also contribute. Below -100oC, the reaction is too low to produce a significant effect in practical time period. So RT is the optimum .
Cyclic loading Figure 8.20Comparison of (a) cyclic fatigue in metals and (b) static fatigue in ceramics. of metals Static loading of ceramics
Figure 8.21Fatigue behavior for an acetal polymer at various temperatures. Acetal polymers are known to have good fatigue resistance. The fatigue limit for polymers is reported to be 106. P. 257
Examples and Practice Problems : Students are asked to review the “Example” of 8.4 and 8.5 and solve the “Practice Problem” of 8.4 and 8.5 in the text.
8.4 Nondestructive Testing NDT is the evaluation of materials without impairing their usefulness. The main purp-ose of NDT technique is the identification of potential critical flaws, such as surface and internal cracks. (λ<1nm) Figure 8.22A schematic of x-radiography. pore As with fracture mechanics, NDT can serve to analyze an existing failure or it can be used to prevent future failure. The dominant techniques of this field are x-radiography and ultrasonics. inclusion
X-radiography produces a shadowgraph of the internal structure of a part with a much coarser resolution, typically on the order of 1 mm. The medical chest x-ray is a common example. Industrial x-radiography is widely used for inspecting castings and weldments. For a given material being inspected by a given energy x-ray beam, the intensity of the beam, I, transmitted through a thickness of material, x, is given by Bee’s law ; I = Ioe-μx(8.4) where Io is the incident beam intensity and μ is the linear absorption coeff. for the material. The value of μ is function of the beam energy (See Table 8.5 ) and of the elemental composition of the material (See Table 8.6 ).
As the incident beam energy increases, the value of μ is decreased. This is because of the fact that, stronger Io value makes the material to be easily penetrating the beam, i.e., smaller μ values.
Under a given beam energy, the value of μ is increased with the atomic number. That is, the higher the atomic number, the less the transmitted beam intensity.
Ultrasonic test is one of the most frequently used NDT techniques. While x-radiography is based on a portion of the electromagnetic spectrum with relatively short wave lengths in comparison with the visible region, ultrasonictesting is based on a portion of the acoustic spectrum (λ=1~25 MHz) with frequencies well above those of the audible range (λ=20 ~20,000Hz). Figure 8.23A schematic of a pulse echo ultrasonic test. The difference between x-ray and ultra-sonic testing is that the ultrasonic waves are mechanical in nature, requiring a tran- smitting medium (usually H2O), while x-ray can be transmitted in a vacuum. Piezoelectric transducer (tranamitting medium) The key factor in ultrasonic testing is the reflect-ion of the ultrasonic waves at interfaces of dissi-millar materials. The high degree reflectivity by a typical flaw, such as an internal cracks, is the basis for defect inspection. (See left figure)
Examples and Practice Problems : Students are asked to review the “Example” of 8.6 and solve the “Practice Problem” of 8.6 in the text.
8.5 Failure Analysis and Prevention Failure analysis and prevention are important parts of the application of materials in engineering design. There is now well-established, systematic methodology for Failure analysis of engineering materials. The related issue of failure prevention is equally important for avoiding future disasters.