Download
1 / 39
1.12k likes | 2.64k Vues
Chapter 8: Failure of Metals. ISSUES TO ADDRESS. • How do flaws in a material initiate failure?. • How is fracture resistance quantified; how do different material classes compare?. • How do we estimate the stress to fracture?. • How do loading rate, loading history, and temperature

E N D
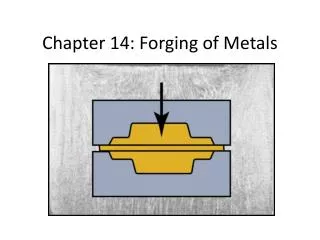
Chapter 8: Failure of Metals ISSUES TO ADDRESS... • How do flaws in a material initiate failure? • How is fracture resistance quantified; how do different material classes compare? • How do we estimate the stress to fracture? • How do loading rate, loading history, and temperature affect the failure stress? Computer chip-cyclic thermal loading. Hip implant-cyclic loading from walking. Ship-cyclic loading from waves.
Fracture mechanisms • Ductile fracture • Occurs with plastic deformation • Brittle fracture • Little or no plastic deformation • Catastrophic
Very Moderately Fracture Brittle Ductile Ductile behavior: %AR or %EL Large Moderate Small Ductile vs Brittle Failure • Classification: • Ductile fracture is usually desirable! Ductile: warning before fracture Brittle: No warning
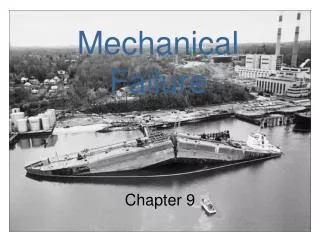
Example: Failure of a Pipe • Brittle failure: --many pieces --small deformation • Ductile failure: --one piece --large deformation
Moderately Ductile Failure • Evolution to failure: Small cavity formation Coalescence of cavities to form a crack Initial necking Final shear fracture Crack propagation
Moderately Ductile Failure 50 mm 50 mm 100 mm • Resulting fracture surfaces (steel) Fracture surface of tire cord wire loaded in tension. Particles serve as void nucleation sites.
Ductile vs. Brittle Failure brittle fracture cup-and-cone fracture
Brittle Failure Arrows indicate pt at which failure originated
Brittle Fracture Surfaces • Intragranular or Transgranular (within grains); most brittle materials
Brittle Fracture Surfaces • Intergranular (between grains)
Flaws are Stress Concentrators! Results from crack propagation • Griffith Crack where t = radius of curvature so = applied stress sm = stress at crack tip Kt = Stress concentration factor t
s max Stress Conc. Factor, K t = s o s 2.5 max 2.0 increasing w/h 1.5 r/h 1.0 0 0.5 1.0 sharper fillet radius Engineering Fracture Design • Avoid sharp corners! s o w h r , fillet radius
Crack Propagation Cracks propagate due to sharpness of crack tip • A plastic material deforms at the tip, “blunting” the crack. deformed region brittle Energy balance on the crack • Elastic strain energy- • energy stored in material as it is elastically deformed • this energy is released when the crack propagates • creation of new surfaces requires energy plastic
When Does a Crack Propagate? Crack propagates if above critical stress, σc where • E = modulus of elasticity • s= specific surface energy • a = one half length of internal crack • Y = Dimensionless parameter • Kc = Fracture Toughness = sc/s0 For ductile => replace gs by gs + gp where gp is plastic deformation energy i.e., sm>sc orKt> Kc
Three Mode of Crack Displacement Mode I Opening or Tensile mode Mode III Tearing mode Mode II Sliding mode
Graphite/ Metals/ Composites/ Ceramics/ Polymers Alloys fibers Semicond 100 1 C-C (|| fibers) Steels 7 0 6 0 Ti alloys 5 0 4 0 Al alloys 3 0 ) Mg alloys 0.5 2 0 2 Al/Al oxide(sf) 4 Y O /ZrO (p) 2 3 2 1 C/C ( fibers) 10 3 Al oxid/SiC(w) (MPa · m 5 Si nitr/SiC(w) Diamond 7 4 Al oxid/ZrO (p) 2 6 Si carbide 6 Glass/SiC(w) 5 PET Al oxide Si nitride 4 PP Ic 3 PVC K 2 PC 1 <100> 6 Glass PS Si crystal <111> 0.7 Glass - soda Polyester 0.6 Concrete 0.5 Plain Strain Fracture Toughness
Design Against Crack Growth K ≥ Kc= --Result 2: Design stress dictates max. flaw size. --Result 1: Max. flaw size dictates design stress. amax s fracture fracture no no amax s fracture fracture • Crack growth condition: • Largest, most stressed cracks grow first!
Design Example • Use... --Result: 112 MPa 9 mm 4 mm Answer: • Material has Kc = 26 MPa-m0.5 • Two designs to consider... Design B --use same material --largest flaw is 4 mm --failure stress = ? Design A --largest flaw is 9 mm --failure stress = 112 MPa • Key point: Y and Kc are the same in both designs. • Reducing flaw size pays off!
TS sy Larger loading rate e TS Smaller loading rate sy e e Loading Rate • Increased loading rate... -- increases sy and TS -- decreases %EL • Why? An increased rate gives less time for dislocations to move past obstacles. s
(Charpy) (Izod) final height initial height Impact Testing
Temperature FCC metals (e.g., Cu, Ni) BCC metals (e.g., iron at T < 914°C) polymers Brittle More Ductile Impact Energy s High strength materials ( > E/150) y Temperature Ductile-to-brittle transition temperature • Increasing temperature... --increases %EL and Kc • Ductile-to-Brittle Transition Temperature (DBTT)...
specimen compression on top motor counter bearing bearing flex coupling tension on bottom s s max S s m s time min Fatigue • Fatigue = failure under cyclic stress. • key parameters -- S, σm, σmax and frequency • Key points: --can cause part failure, even though smax < sc. --causes ~ 90% of mechanical engineering failures.
Fatigue Design Parameters S = stress amplitude case for Al (typ.) unsafe safe 3 5 7 9 10 10 10 10 N = Cycles to failure S = stress amplitude • Fatigue limit: --no fatigue if S < fatigue limit case for unsafe steel (typ.) Fatigue limit safe 3 5 7 9 10 10 10 10 N = Cycles to failure • Sometimes, the fatigue limit is zero!
Fatigue Mechanism • Crack grows incrementally typ. 1 to 6 crack origin increase in crack length per loading cycle • Failed rotating shaft --crack grew even though Kmax < Kc --crack grows faster as • Ds increases • crack gets longer • loading freq. increases. Final rupture
Beachmarks and Striations • Beachmarks • Macroscopic dimension • Found in component that interrupted during crack propagation stage • Striations • Microscopic dimension • Represent advance distance of crack front during single load cycle Single beachmark may contain thousands of striations
s m s m s m better bad bad better Improving Fatigue Life 1. Mean stress S = stress amplitude Increasingm near zero or compressive moderate tensile Larger tensile N = Cycles to failure 2. Remove stress concentrators.
shot Improving Fatigue Life • Surface Treatment (imposing residual compressive stress within thin film outer surface layer) --Method 1: shot peening
C-rich gas Improving Fatigue Life • Surface Treatment (imposing residual compressive stress within thin film outer surface layer) --Method 2: carburizing or nitriding
Other Fatigue due to Environment • Thermal fatigue σ = αEΔT Normally induced at elevated temperature • Corrosion fatigue deleterious influence and produce shorter fatigue life
s s,e t 0 Creep Sample deformation at a constant stress (s) vs. time Primary Creep: slope (creep rate) decreases with time. (Strain Hardening) Secondary Creep: steady-state i.e., constant slope. (Recovery) Tertiary Creep: slope (creep rate) increases with time,i.e.acceleration of rate.
Creep tertiary primary secondary elastic • Occurs at elevated temperature, T > 0.4 Tm
Secondary Creep e Steady state creep rate (%/1000hr) s • Strain rate is constant at a given T, s -- strain hardening is balanced by recovery stress exponent (material parameter) activation energy for creep (material parameter) strain rate applied stress material const. 2 0 0 • Strain rate increases for higher T, s 427°C 10 0 538 °C Stress (MPa) 4 0 2 0 649 °C 10 -2 -1 10 10 1
• Failure: along grain boundaries. g.b. cavities applied stress 12 16 20 24 28 24x103 K-log hr • Time to rupture, tr function of applied stress temperature 1073K Ans: tr = 233 hr time to failure (rupture) Creep Failure • Estimate rupture time S-590 Iron, T = 800°C, s = 20 ksi 100 20 Stress, ksi 10 data for S-590 Iron 1 3 L(10 K-log hr)
SUMMARY • Engineering materials don't reach theoretical strength. • Flaws produce stress concentrations that cause premature failure. • Sharp corners produce large stress concentrations and premature failure. • Failure type depends on T and stress: - for noncyclic s and T < 0.4Tm, failure stress increases with: - decreased maximum flaw size, - increased T, - decreased loading rate. - for cyclic s: - cycles to fail increases as Ds decreases. - for higher T (T > 0.4Tm): - time to fail increases as s or T decreases.