
A Database Perspective on Sensor Networks
E N D
Presentation Transcript
A Database Perspective on Sensor Networks Philippe Bonnet Cornell University bonnet@cs.cornell.edu
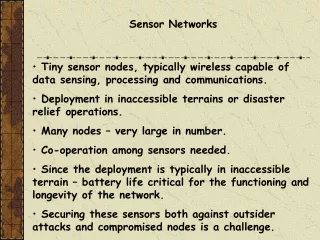
Outline • Introduction • Applications • Sensor Networks & Database Technology • Part I: Sensor Networks • What are the capabilities of sensor nodes and of sensor networks? What is the nature of sensor data? • Part II: Database Technology • What are the relevant aspects of DB technology? Can they be applied in the context of sensor networks? What are the new problems?
Sensor-based Application #1 http://www.spyplanes.com/ http://www.millennium.berkeley.edu/tinyos/uav.html
Sensor-based Application #2 Internet http://www.media.mit.edu/resenv/vehicles.html http://www.media.mit.edu/resenv/ (Ara Knaian’s thesis)
Sensor-based Application #3 Long-range Radio http://birds.cornell.edu/
Energy Efficient Scalable Accurate Reliable Low Latency Area Monitoring Applications Declarative Access Signal Processing (Sensor Tasking)
Area Monitoring Applications On-demandSensor Tasking Application #3 (fixed point for data collection) Application #1 (mobile point for data collection) On-demandaccess to sensor data Predefinedaccess to sensor data Application #2 One-TimeSensor Tasking
Declarative Access to Sensor Data • SQL Queries over a Sensor Network [T00][BS00] • Access to large collection of sensors • Associative access independent of the physical organization of the sensor network Example #1: Every minute return the measurement obtained from Region X. Example #2: Whenever two sensors within 5 yards of eachother detect a bird then return their location. Example #3: Every five minutes return the number of birds detected in Region X.
Database Analogy Declarative SQL Query Data Extraction SQL Engine Storage Manager Sensor Network Data on Disk Sensors
Sensor Database System Declarative SQL Query SQL Engine Sensor Network Storage Manager Data on Disk Sensors Adapting database technology to support declarative access to sensor data in the context of area monitoring applications
Other Sensor-based Applications • Condition-based maintenance • Product Quality Monitoring • Device management • Smart office spaces • Home automation • Networked cars • … The opportunities for database technology might exist but are less obvious
Issues from a Database Perspective • What is sensor data? • How is sensor data accessed? • What about data storage and processing capabilities on sensor nodes? • What is the cost of accessing sensor data? • What kind of abstraction to use in order to represent a sensor network? • Ideas to reuse?
WINS NG Sensor Nodes RF Modem AnalogI/O DSP Real-TimeInterfaceProcessor DigitalI/O ControlProc. PowerPC32 bitsProcessor Powersupply GPS Ethernet http://www.sensoria.com/
Laser diode III - V process Passive CCR comm . MEMS/ polysilicon Active beam steering laser comm . MEMS/optical quality polysilicon Analog I/O, DSP, Control COTSCMOS Sensor Powercapacitor MEMS/bulk, surface, ... Multi - layerceramic Solarcell CMOS or III - V Thick film battery Sol/gel V O 2 5 1 - 2 mm Smart Dust Motes http://robotics.eecs.berkeley.edu/~pister/SmartDust/
COTS Macro Dust Motes http://www-bsac.eecs.berkeley.edu/~shollar/macro_motes/macromotes.html
Processing Capabilities • WINS NG : • General Purpose Processor - PowerPC • 66 MHz– 87 MIPS – 16 MB RAM • DSP – TI5402 • 100 MHz, 25 ksps input, 5ksps output to processor • Macro Motes: • Micro-controller - AMTEL MCU • 4 MHz, 8 kb of program memory, 512 of data memory. • Idle, power down, power save modes.
Communication Capabilities • Radio Frequency • WINS NG • WINS2.0 modem – 2.4 GHz - Frequency Hopping - 56 kbps – 30 m range • Macro Motes • RFM T1000 – 900 MHz - On/Off Key Encoding – 10 kbps – 20 m range • Optical Communication • Smart Dust • Passive Corner Cube Reflector – On/Off Key Encoding (downlink) - 1kbps link over 500 m range
Optical Networking J. M. Kahn, R. H. Katz and K. S. J. Pister, "Mobile Networking for Smart Dust", ACM/IEEE Intl. Conf. on Mobile Computing and Networking (MobiCom 99).
Cluster: 1 Master / N Slaves Master synchronizes communications in a cluster (TDMA) Dual radio used in WINS NG to allow for multi-hop communication across clusters S S M S S S M M S S Piconet ftp://ftp.uk.research.att.com/pub/docs/att/tr.97.9.pdf The Bluetooth Radio System: Jaap C. Haartsen. IEEE PC Feb 2000
Energy densities (Wh/L) Li-ion: 500 (~1.8J/mm3) Li/So2: 176 Alkaline: 80 Nickel Cadmium: 40 Moore’s law does not apply to batteries Batteries Courtesy of Marc Doyle, DuPont Joe Paradiso’s survey of “renewable energy sources for the futureof mobile and embedded computing” http://www.media.mit.edu/resenv/
Smart Dust Objective: each mote should consume less than 1 J / day (amount of energy produced by solar cells) Towards 10 pJ/ instruction for dedicated microcontrollers 1nJ to transmit a bit with CCR passive transmitter Macro Motes 1 J to transmit a bit; 0.5 J to receive a bit (10kpbs & 10mW) 10 nJ / instructions WINS 10 J to transmit a bit (i.e., 100 mW transmit power and 100 ms to send a 32 bytes packet – very conservative estimate) 1 nJ/ instructions Energy Consumption Executing an instruction costs orders of magniture less than sending a bit of data
Timer Time Series FFT Adaptive Normalizer Energy Detect Decision Event No Event Threshold Signal Processing: Basics • Measurement • Detection • Classification • Localization • Tracking A time stamp is associated toeach signal processing output Fundamentals of Statistical Signal Processing, Vol I&II by Steven McKay
Data Fusion In: Observations from different sensors Out: Weight associated to hypothesis Approach Inferences (Bayesian, genetic algorithm, …) Peer-tasking Signal Processing: Data Fusion R.Brooks and S.Iyengar. Multi-sensor Fusion: Fundamentals and Applications with Software. Prentice Hall.
Publish-Subscribe interface Gradient based routing Data is sent on multiple routes Reinforcement learning Chooses good route Adapts to node failures In-network aggregation RF Networking: Directed Diffusion SCADDS Project - http://www.isi.edu/scaddsDataSpaces - http://www.cs.rutgers.edu/dataman DSN Project - http://www.east.isi.edu/projects/DSN/
Operating System: Requirements • Compact scale • Small footprint, efficient use of instruction set • Efficient Multithreading • Concurrency-intensive operations • Sensor data + network data (+ GPS data) • Efficient drivers • Limited levels of abstractions • Migration across hardware/software boundaries • Modularity • Composition of modules for each type of sensor node • Support for mobile code • Robust operations • Memory management
Operating System:tinyOS Route map router sensor appln application Active Messages packet Serial Packet Temp Radio Packet SW byte HW UART Radio byte i2c photo bit clocks RFM J.Hill, R.Szewczyk, A.Woo, S.Hollar, D.Culler, K.PisterSystem Architecture Directions for Networked Sensors. ASPLOS 2000. http://www.cs.berkeley.edu/~jhill/tos/
Front-end Front-end Design Space Sensor Pack WINS NG Macro Motes Multi-hoptopology Star topology Smart Dust “Systemon a chip”
What is Sensor Data? • Sensor data is generated by signal processing functions • Measurements • Detections • Classification • Time stamp associated to each sensor data item • Sensor data produced by individual sensors or groups of sensors • If no “peer tasking” is used then the group of sensors that produce data is the group of sensors on which the signal processing functions are invoked.
How is Sensor Data Accessed? • Multi-hop RF network • Front-end connected to gateways nodes • Sensor nodes that produce data are sources, gateway nodes are sinks. • Processing can be pushed in multi-hop network in order to trade increased local processing for reduced traffic. • Optical network • Front-end obtains data from all the nodes in its line of sight. • Star Topology.
What About Data Storage and Processing Capabilities on the Nodes? • Sensor pack • Large processing capabilities and buffer space • System on a chip • Restricted processing capabilities and buffer space • Data items should be processed as they are generated • No elaborate processing on the sensor nodes • No historical data is maintained • Possible hierarchy of sensor nodes • A few sensor packs arranged in a multi-hop network • To each sensor pack is attached lots of miniature sensors (system on a chip).
What is the Cost of Accessing Sensor Data? • Energy is the scarce resource • Processing • Storage • Transmission • Local processing is orders of magnitude cheaper than transmission • Propagation with nodes on the ground accentuates this characteristic
What kind of abstraction to represent a sensor network? • G = (V,E) • Vertices represent sensor nodes • Edges represent connected sensor nodes • Model#1: The graph of connected nodes is fully connected. Each edge is annotated with the cost of the transmission between any two nodes. • Relies on routing layer • How to estimate cost of transmission? • Model#2: The graph of connected nodes is not fully connected. An edge represents a single hop • Relies on physical layer • Stable for limited periods of time
Ideas to Reuse? • Energy efficient, small footprint solutions • Easy to reconfigure, “0 administration” systems • Reinforcement learning • Finding an optimal solution in a dynamic environment • Event-based processing • Streams of sensor data items need be processed as they are produced
Declarative Access to Sensor Data • Sensors are data sources • Queries to access sensor data regardless of physical organization Example #1: Every minute return the measurement obtained from Region X. Example #2: Whenever two sensors within 5 yards of eachother detect a bird then return their location. Example #3: Every five minutes return the number of birds detected in Region X.
Queries over a Sensor Network • Do data fusion, directed diffusion, and query processing share the same notion of query? • Yes • Collect, filter, correlate, aggregate sensor data • … and No • Data Fusion: hypothesis testing in a neighborhood • Directed Diffusion: efficient, scalable cross-layer routing • Query Processing: SQL queries over sensor data • From a query processing viewpoint • Support for data fusion? • Integration with network routing?
Warehousing Approach • Data is extracted from sensors and stored on a front-end server • Query processing takes place on the front-end. Warehouse Front-end Sensor Nodes
Sensor Database System • Sensor Database System supports distributed query processing over a sensor network SensorDB SensorDB SensorDB SensorDB SensorDB Front-end SensorDB SensorDB SensorDB Sensor Nodes
Sensor Database System • Characteristics of a Sensor Network: Streams of data, uncertain data, large number of nodes, multi-hop network, no global knowledge about the network, failure is the rule, energy is the scarce resource, limited memory, no administration, … • Can existing database techniques be reused in this new context? What are their limitations? • What are the new problems? What are the new solutions?
Issues • Representing sensor data • Representing sensor queries • Processing query fragments on sensor nodes • Distributing query fragments • Adapting to changing network conditions • Dealing with site and communication failures • Deploying and Managing a sensor database system
Performance Metrics • High accuracy • Distance between ideal answer and actual answer? • Ratio of sensors participating in answer? • Low latency • Time between data is generated on sensors and answer is returned • Limited resource usage • Energy consumption: E (J) = Wcpu (J/inst) * CPU (inst) + Wram (J/b) * RAM (b) + Wmsg (J/msg sent) * nb msg sent + Wbdw (J/b) * bytes sent (b)
Representing Sensor Data and Sensor Queries • Sensor Data: • Output of signal processing functions • Time Stamped values produced over a given duration • Inherently distributed • Sensor Queries • Conditions on time and space • Location dependent queries • Constraints on time stamps or aggregates over time windows • Event notification
Schema-Level Each type of sensor is represented as an ADT To each signal-processing function is associated an ADT function that returns a sequence A sequence associates sets of records with positions (elements in an ordered domain). The COUGAR Model detect TimeStamp SensorId In Out T1 #1 90 True #2 90 True T2 #1 90 True T4 #3 90 True
Long-running SQL queries Sequence functions over sensor ADT functions (returning sequences) New sensor data items appended to sequence as they are produced Materialized view updated as sensor data items are appended The COUGAR Model detect TimeStamp SensorId In Out T1 #1 90 True #2 90 True T2 #1 90 True T4 #3 90 True Select R.s.detect(90).project(s1.sensorId)From R Where $every(60); P.Bonnet, J.Gehrke, P.Seshadri. Towards Sensor Database Systems. MDM’01 http://www.cs.cornell.edu/database/cougar
A Measure Theoretic Probabilistic Data Model • Outputs of a signal processing function might be continuous probability distributions • Extension of data model for discrete probability distributions using measure theory • Specific model for multidimensional parametric distributions (e.g., Gaussians) • Event probabilities • Comparisons Detection TimeStamp SensorId In Out T1 #1 90 T1 #2 90 T2 #1 90 T4 #3 90 T.Faradjian, J.Gehrke, P.Bonnet. A Model Theoretic Probabilistic Data Model.Cornell Technical Report . December 2000.
Data Model DataSpaces: spatial decomposition of physical space Each sensor is an abstract data type InfoDispensers Data aggregation devices Spatial Web For organizing and representing information aggregated by InfoDispenders WebDust T.Imielinski, S.Goel. DataSpace – Queryingand Monitoring Deeply Networked Collectionsin Physical Space. MobiDE 1999. http://www.cs.rutgers.edu/dataman/webdust
Data model Ontology that contains class information World State that contains device data XML encoding DevL language Rules are defined for each device ECA model for querying and updating the World State Control Language in Sagres http://data.cs.washington.edu/ubiquitous/sagres/
Event Model Similar to LDAP data model An event type is associated to a set of attributes An event instance includes a set of values Subscription Language A subscription is a conjunction of conditions on attributes An event instance e matches a subscription s if e provides a binding for every attribute occurring in s and all predicates in s are true with respect to this binding Subscription Language in LeSubscribe J.Pereira et al. Publish/Subscribe on the Web at Extreme Speed. VLDB 2000.