Download
1 / 34
340 likes | 484 Vues
ENROLLMENT MANAGEMENT and NEW STUDENT PROFILE Jay Goff Aug 22, 2002. 2001. 2002. 2003. 2004. 2005. 2006. Freshmen. 715. 755. 790. 825. 865. 900. Transfer. 231. 270. 300. 350. 390. 425. Graduate*. 395. 401. 407. 413. 419. 425. Total Enrollment. 4987. 5200. 5400.

E N D
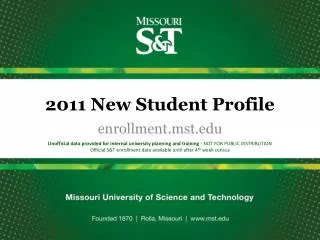
ENROLLMENT MANAGEMENT and NEW STUDENT PROFILE Jay Goff Aug 22, 2002
2001 2002 2003 2004 2005 2006 Freshmen 715 755 790 825 865 900 Transfer 231 270 300 350 390 425 Graduate* 395 401 407 413 419 425 Total Enrollment 4987 5200 5400 5600 5800 6000 Graduate targets include MS, PhD, and certificate programs UMR Enrollment Goals
Enrollment Goals • TOTAL ENROLLMENT: 6000 • 900 Freshmen • 425 Transfer Students • 4800 Undergraduates • 1200 Graduate Students • 5500 students on the Rolla Campus • 500 students in extended learning/internet • Freshmen to Sophomore Retention Rate: 88% • 6 Year Graduation Rate: 67% • Achieve Enrollment Goals by 2006-07
Student Profile Goals • Average ACT = 27 • 60% Male, 40% Female • 10% Minority Student Population • 75% In-state, 25% Out-of-state
Recent Enrollment Success 2000 2001 2002 Freshmen 696 715 815 Transfers 195 231 267 Graduate 348 395 459 TOTAL 1239 1341 1541 +300 New Students over FS2000, + 17%
Top Competition – OverallRank by # of ACT score Reports Sent to UMR & Competing Institutions 1. UM-Columbia 963 2. Southwest Missouri St. 475 3. Washington University-St.L 323 4. Truman State 252 5. University Illinois 248 6. UM-St. Louis 238 7. Southeast Missouri St. 208 8. Saint Louis University 189 9. UM-Kansas City 177 10. Central Missouri State 170 11. Univ. of Kansas 143 12. Kansas State 135 13. Mass. Institute of Tech 134
TOP 10 Feeder High Schools** FALL 2001 HIGH SCHOOL #Enrolled Ave ACT #Apply Ave. ACT 1. Rolla HS 19 27.9 56 25.0 2. Marquette HS 14 25.7 31 23.6 3. Francis Howell N. 10 24.2 28 23.3 4. Oakville 9 28.1 22 27.0 5. Camdenton 7 28.6 12 26.8 6. Vianney 6 25.2 11 25.3 7. St. Charles High 6 28.0 8 27.1 8. Waynesville 6 25.8 22 24.3 9. Hazelwood Central 5 26.0 29 23.4 10.Parkway South 5 26.2 19 26.9 10. Parkway West 5 26.4 21 26.1
2002 New Programs • Business and Management Systems • Business Administration • Management Information Systems • Information Science Technology • Architectural Engineering • Environmental Engineering (BS) • New Pre-Med option in Chemistry • Civil Engineering Options • Materials Engineering (ME) • New Psychology Options
MISSOURI HIGH SCHOOL SENIORS INTERESTED IN ENGINEERING AND TECH FIELDS ACT MAS – Statewide Market Analysis Reports
Applied Mathematics Biological Sciences Business Administration Chemistry Computer Science Economics English Geology & Geophysics History & Political Science Information Science & Technology Management Info. Systems Philosophy Physics Psychology “Pre-Med, Pre-Law” Teacher Certifications Engineering Aerospace Engineering Architectural Engineering Ceramic Engineering Chemical Engineering Civil, Environmental Eng (MS) Computer Engineering Electrical Engineering Engineering Management Engineering Mechanics (MS) Environmental Engineering Geological Engineering Mechanical, Manufacturing Eng (MS) Metallurgical Engineering Mining Engineering Nuclear Engineering Petroleum Engineering Systems Engineering (MS) UMR Degree Programs
NEW FEES:Undergrad Admission App: $35Graduate Admission App: $50
New Student Profile • 83% Missouri college bound students have only one or no brother/sister (most never shared a bedroom or bathroom) • Over 50% of new Missouri college students come from single parent or divorced homes • Over 70% of UMR students’ parents have some college education, a bachelor degree or higher. (75% mothers, 74% fathers) • Over 67% plan to work while in college • Over 90% plan to join a student organization • 81% plan to complete a co-op or internship before graduation • 96% of incoming freshmen have access to and know how to use internet • 87% Already own a personal computer • 58% spend 5 hours or less per week on the internet • 12% spend more than 15 hpw • Over 94% plan to live on campus • Over 65% have credit cards & standing debt
Student Profile • About 5,200 students – 4,100 undergrad, 1,100 graduate • Midrange ACT: 25-30, Average: 27.4 40% ranked in top 10% of high school class • Over 96% of all UMR graduates secure a position in their field/area of choice within 3 months of graduation. • Average starting salary of 2001 graduates exceeded $47,000.00 • 71% Missouri residents, 26% female, 8% minority students, 12% international students • 58% of Freshmen are likely to attend graduate school • 29% of the Freshmen are already planning on earning a Masters or PhD
University Enrollments are Geographically DrivenCampus Locations Influence on Students Choice • 73.2% of high school seniors will only travel an average of 130-150 miles from home. SOURCE: STAMATS 2000 national high school survey • 80% of all freshmen in Fall 1996 who graduated from high school attended colleges in their home states. SOURCE: The 2000 Chronicle of Higher Education • Institutions desiring to grow need significant populations close to the home campus
IMPORTANT REASONS FOR ATTENDING COLLEGE/UMR • 99% To improve academic skills • 98% To get a better job • 96% To improve themselves • 81% To take part in college social life • 66% To prepare for graduate school • 26% To better develop athletic skills
IMPORTANT REASONS WHY THEY CHOSE UMR • 98% UMR offered their desired academic program • 97% The quality of UMR’s academic reputation • 91% UMR’s smaller class sizes • 88% UMR’s scholarship and financial aid offer • 84% UMR’s cost compared to other schools • 82% UMR’s prompt responses • 78% Friends and Family’s input • 79% The personalized attention that UMR offers • 76% The campus visit/tour • 68% UMR’s geographic location Interesting Note: 58% High school teacher’s input 50% High school counselors input
WHEN DID STUDENTS FIRST BECOME INTERESTED IN UMR • 31% Senior year in high school • 25% Junior year in high school • 15% Between Junior and Senior year • 26% Prior to Junior year in high school
WHERE STUDENTS FIRST LEARNED ABOUT UMR • 60% Friends and Family • 11% Other sources • 10% High School guidance counselor • 6% High School teachers • 5% UMR Advertising • 4% College Fairs • 3% Internet/Homepages • 2% Media/newspapers
NEW STUDENT EXPECTATIONS • 61% expect to complete their degree in 4 years • 93% expect to complete their degree in 4 to 5 years • 6% expect to complete their degree in 6 or more years NOTE:only 57% of UMR students complete their degrees in 6 or less years. • That is one of the state’s highest graduation rates • UMR wants to improve the six-year graduation rate to 68% by 2011.
GPA in High School VS.Expected GPA at UMR • 93% reported a 3.0 GPA or higher • 69% 3.5 or higher • 24% 3.0 to 3.49 • 6% 2.5 to 2.99 • 1% 2.0 to 2.49 • 94% expect a 3.0 GPA or higher • 43% 3.5 or higher • 52% 3.0 to 3.49 • 5% 2.5 to 2.99 • 1% 2.0 to 2.49 NOTE: In 2000-01, the Average UMR GPA was 2.9 Freshman Ave: 2.913 Sophomore Ave: 2.927 Junior Ave: 3.042 Senior Ave: 3.069 Male Ave: 2.9 Female Ave: 3.1
Average Number of Hours Per Week Spent Studying in High School • 74% 5 hours or less • 5% 15 hours or more • 44% Less than two hours • 31% 3 to 5 hours • 16% 6 to 10 hours • 5% 11 to 15 hours • 5% More than 15 hours
Expected Number of Hours Per Week Spent Studying at UMR • 14% 5 hours or less • 16% 15 hours or more • 1% Less than two hours • 13% 3 to 5 hours • 36% 6 to 10 hours • 34% 11 to 15 hours • 5% More than 15 hours NOTE: UMR recommends all students to studying 1.5 to 2 hours outside of class for every 1 hours spent in class. Current students have claim to study between 20 and 28 hours per week.
How Often Freshmen Expect to meet with Faculty outside of class/lab • 24% Very Often • 70% Sometimes • 6% Not often
How Involved Freshmen feel faculty should be in their Career Development • 54% Very Involved • 46% Somewhat Involved • 1% Not Involved
Over 96% of all UMR graduates secure a position in their field/area of choice within 3 months of graduation. Average starting salary of 2001 graduates exceeded $47,000.00 UMR provides students with unusually early access to meaningfulresearch as well as co-op and internship programs, providing students with relevant experience in their chosen field UMR has both the second largest engineering-focused career fair and the highest national ratio of interviewing employers to graduating seniors in all the Midwest The DIFFERENCE - 1
The DIFFERENCE - 2 • SMALL CLASSES & LABS - Gives Students the Personal Attention and Opportunities to Become Their Best • UMR student-to-faculty ratio of 13:1, versus comparable universities with 19:1 • Ave. UMR class size: 26 • Ave. UMR lab size: 15 • UMR has earlier & more personal access to leading, renowned educators and researchers
The DIFFERENCE - 3 • UMR offers over 200 student organizations and provides students with the opportunities to grow, participate, and become leaders • Rolla – Among USA’s 2002 Top 10 Best College Towns • The city, just under 20,000, was recognized for its vibrant activities, commitment to intellectual growth & strong economy. A safe place live, study, and grow. Selected as a location where alumni want to live and where employers want to locate.
3 Rules for GoodStudent Service • You are the University. • Treat all new students like guests in your home • Find Reasons to Say YES!