Subjects, Participants, and Sampling
Subjects, Participants, and Sampling. The proof of the pudding is in the eating. By a small sample we may judge of the whole piece. Miguel de Cervantes Saavedra Spanish Writer, 1547-1616. Definitions. • Subject or participant: A person from whom data are collected.


Subjects, Participants, and Sampling
E N D
Presentation Transcript
The proof of the pudding is in the eating. By a small sample we may judge of the whole piece.Miguel de Cervantes Saavedra Spanish Writer, 1547-1616
Definitions • • Subject or participant: A person from whom data are collected. • – Subject is the term often used in a quantitative context; participant is used in a qualitative context. • • Sample: The collective group of subjects or participants from whom data are collected • • Population: A large group of individuals to whom the results of a study are to be generalized.
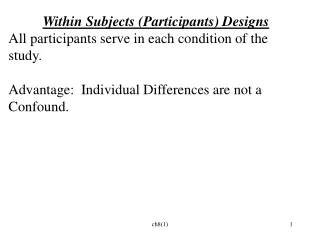
Two Types of Sampling Procedures • • Probability: Statistically-driven sampling techniques where the probability of being selected is known. The purpose is to select a group of subjects representative of the population. (Think quantitative) • • Non-Probability: Pragmatically-driven sampling techniques where the probability of being selected is unknown. The purpose is to select particularly knowledgeable participants. (Think qualitative)
Goals for Quantitative Sampling • • To select a sample that is representative of the population you will generalize your results to. • • To reduce sampling error and bias • – Sampling error: The difference between the “true” result and the “observed” result that can be attributed to using samples rather than populations. • – Sampling bias: The difference between the “observed” and “true” results that can be attributed to errors made by the researcher.
Strategies for Quantitative Sampling • • Simple Random • • Stratified Sampling • • Cluster Sampling • • Convenience Sampling
Simple Random • • A number is assigned to each subject in the population and a table of random numbers or a computer is used to select subjects randomly from the population.
1970 Viet Nam War Draft Lottery Last # Called Call Number Birth Date
Systematic Sampling • • Proportional Stratified Sampling: The proportion of subjects in each strata in the population are reflected in the proportions of subjects in each strata of the sample. • • Disproportional Stratified Sampling: The proportions of subjects in each strata in the sample are the same regardless of the proportions of subjects in the strata of the population.
Cluster Sampling • • Similar to random sampling except that naturally occurring groups are randomly selected first, then subjects are randomly selected from the sampled groups. • – Typical educational clusters are districts, schools, or classrooms.
Convenience Sampling • • Typical of much educational (and other) research given the constraints under which it is conducted. • • The major concern is the limited ability to generalize the results from the sample to a population the audience cares about.
Steps in Quantitative Sampling Key first step: Define the target population. Who do you want to generalize your results to?
Goals for Qualitative Sampling • • To select participants that are particularly knowledgeable about the topic/phenomenon you are researching. • – Who does an investigator or reporter interview? People who are most knowledgeable or have the closest experience with the issue.
Strategies for Qualitative Sampling • • Typical Case: Selecting a representative participant. • • Extreme Case: Selecting a unique or atypical participant. • • Maximum Variation: Selecting at least two participants who represent extreme cases. • • Snowball (aka Network): Selecting participants from recommendations of other participants. • • Critical Case: Selecting the most important participants related to the phenomenon.
Criteria for Evaluating Sampling • • The subjects or participants were clearly described. • • The population was clearly defined. • • The sampling procedure was clearly described. • • The sampling procedure was appropriate for the problem being investigated. • • The selection of subjects was free of bias. • • Adequate sample sizes were used. • • The return rate was reported and analyzed. • • The qualitative study had knowledgeable participants.
Risks Associated with Volunteers • • Different characteristics between volunteers and non-volunteers can lead to non-representative responses. • – Educational level • – Socio-economic status • – Need for social approval • – Ability to socialize • – Conformity • • Commonly used due to availability and convenience.
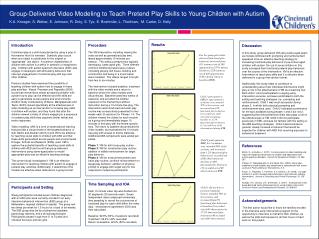
Sample Sizes for Experiments • • For experimental designs, sample size is a function of level of significance, effect size, and power. Change one of these, and the minimum sample size will change. • – For a t-test at the 0.05 level of significance, a power of 0.80, and a small effect size, the minimum sample to produce a statistically significant result is 393 in each group for a total of 786 participants. With a large effect size, the minimum sample would be 26 in each group for a total of 52 participants.
Sample Sizes for Experiments ES = 0.6 1.0 ES = 0.5 minimum power 0.8 ES = 0.4 0.6 Power 0.4 0.2 0.0 0 50 100 150 200 Sample Size Per Group
Sample Sizes for Correlations • • For correlational designs, sample size is also a function of level of significance, effect size, and power. • – For a statistically significant Pearson product-moment correlation at a 0.05 level of significance, a power of 0.80, and a medium effect size, you need 85 people.
Sample Sizes for Surveys • • The minimum sample size for surveys is a function of: • – The margin of error you are willing to accept. This is usually set at 5%. • – The confidence interval you set. Typical choices are 90%, 95%, or 99%. Go with 95%. • – The population size you are targeting. Usually it is quite large, and any number over 20,000 has little effect on sample size. • • For the assumptions above you would need a sample of 384. • – A sample size of ≈ 1,000 will give a margin of error of 3%. • – A sample size of ≈ 100 will give a margin of error of 10%.