The Quality Improvement Model
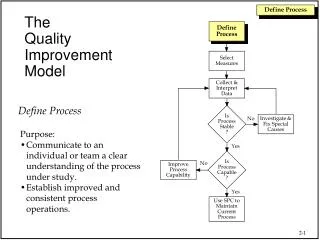
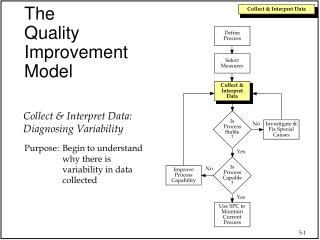
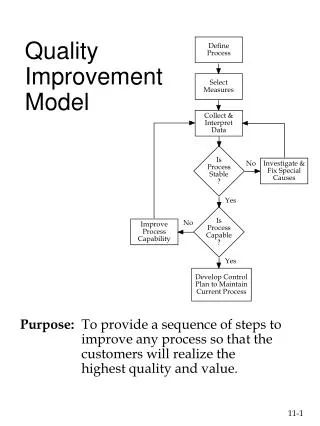
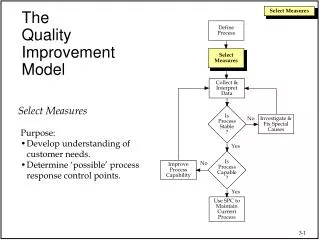
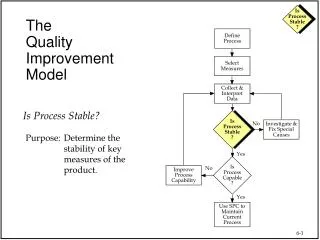
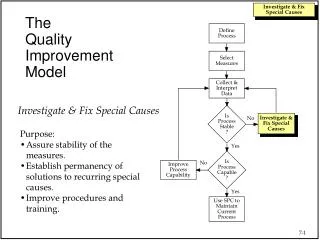
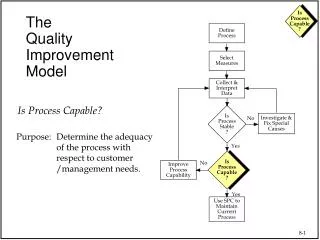
The Quality Improvement Model. Define Process. Select Measures. Collect & Interpret Data. Is Process Capable?. Is Process Stable ?. Investigate & Fix Special Causes. No. Purpose: Determine the adequacy of the process with respect to customer /management needs. Yes. Is Process Capable ?.

The Quality Improvement Model
E N D
Presentation Transcript
TheQualityImprovementModel Define Process Select Measures Collect & Interpret Data Is Process Capable? IsProcessStable? Investigate & Fix Special Causes No Purpose: Determine the adequacy of the process with respect to customer /management needs. Yes IsProcessCapable? No Improve Process Capability Yes Use SPC to Maintain Current Process
2 4 6 8 10 12 14 16 18 20 22 24 26 28 30 32 Capable Process A stable process that meets customer requirements. Histogram Control Chart UCL CL LCL Lower Spec Upper Spec Run Order Target Capability assessments for unstable processes, may not be indicative of how the process is actually performing.
Assessing Process Capability • Counting Measures • The average percent defectives. • The average number of defects. • Instrument Measures • Comparing both the center of the process and the process variation
Week 1 2 3 4 5 6 7 8 9 10 11 12 13 14 15 16 17 18 19 20 Total # Errors 15 22 18 10 13 9 27 12 24 22 8 8 26 16 20 10 16 9 15 20 320 Control Chart 35 30 UCL=28.0 Number of Errors 25 20 Avg=16.0 15 10 5 LCL=4.0 0 5 10 15 20 Week Capability Assessment for Counting Measures“Order Entry Process” Is this process adequate as is? Should it be improved?
Measures of Process Capability Specification Range USL - LSL C = = p True Process Range C p ® = 1.0 Process is marginally capable C p C p Distance from process average to closest specification limit min (USL - x , x - LSL) = C = pk 1 True Process Range 2 C pk C pk C pk 6sc ® < 1.0 Process is not capable of meeting specs ® > 1.0 Process is capable of meeting specs Problem: We are assuming the process has a target that is in the center of the specification range, and that the process is in fact centered on that target. 3sc Note: a negative result is possible if the process average is outside specifications ® < 1.0 Process is not capable of meeting specs ® = 1.0 Process is marginally capable ® > 1.0 Process is capable of meeting specs Benefits: • Optimal values are attained by running exactly between specs. • Can (must) be used for 1-sided specifications Warning: Capability assessments for unstable processes, may not be indicative of how the process is actually performing.
Process Capability USL LSL How much material is out of spec? • In the short term? • In the long term?
Process Capability Ratios LSL USL Voice of The Process Voice of The Customer
Process Capability - The Strategy Defects Defects LSL USL Centering –The Process Is On Target Spread – Reduce The Variation
Process Capability Ratios 2 Key Metrics for Measuring Capability X - LSL USL - X C Min( , ) pk 3 3
Process Capability Ratios - Concept Total Tolerance C p Process Spread
CP & CPK Measure Short-term Capability Is The Process In Control ? Is It Producing Defects ? A Short-term Capability study covers a relatively short period of time (days, weeks) generally consisting of 30 to 50 data points. The actual number depends on the subject under study.
Long Term Performance Short term Capability Is The Process In Control ? Is It Producing Defects ? A long-term capability study covers a relatively long period of time (weeks, months) generally consisting of 100-200 data points. Again, the actual amount depends on the subject under study.
A Further Look at Capability Compare the estimates of the process deviations from the short-term and long-term data Descriptive Statistics Variable N Mean StdDev short term 30 30.6 2.23 long term 180 33.84.44 What is the difference between the short-term and the long-term data? What implication does this have in doing capability studies?
Measures of Process Performance Specification Range USL - LSL P = = p True Process Range 6ss P p ® < 1.0 Process Performance is not meeting specs ® P = 1.0 Process Performance is marginally meeting specs p P p ® > 1.0 Process Performance is meeting specs Problem: We are assuming the process has a target that is in the center of the specification range, and that the process is in fact centered on that target. Distance from process average to closest specification limit min (USL - x , x - LSL) P = = pk 1 True Process Range 3ss 2 Note: a negative result is possible if the process average is outside specifications ® Ppk < 1.0 Process Performance is not meeting specs ® Ppk = 1.0 Process Performance is marginally meeting specs ® Ppk > 1.0 Process Performance is meeting specs Benefits: • Optimal values are attained by running exactly between specs. • Can (must) be used for 1-sided specifications
Performance vs. Capability Days Sales Outstanding for 55 Days DSO These data show that the process, if well controlled can perform much better than it currently is
Capability vs. Performance Days Sales Outstanding for 55 Days DSO Process Performance: Total Variation including shifts and drifts (Pp & Ppk) Capability: Only random or short term variability (Cp & Cpk)
Process Performance Ratios X - LSL USL - X P Min( , ) pk 3 3 The P-family of indices are computationally the same as the C-family of ‘capability’ indices, but use the observed long-term standard deviation.
WARNING!!! Statistical Assumptions Made In Capability Studies 1. Data Comes From a Stable Process • If not, work towards getting the process in control • Don’t despair, you can still make some assumptions about your process in the mean time