Download
1 / 1
10 likes | 141 Vues
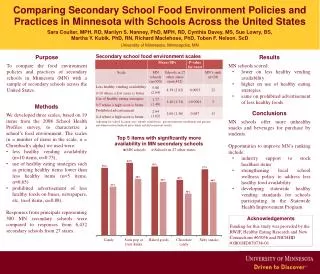
Comparing Secondary School Food Environment Policies and Practices in Minnesota with Schools Across the United States. Sara Coulter, MPH, RD, Marilyn S. Nanney , PhD, MPH, RD, Cynthia Davey, MS, Sue Lowry, BS, Martha Y. Kubik , PhD, RN, Richard Maclehose , PhD, Toben F. Nelson, ScD.

E N D
Comparing Secondary School Food Environment Policies and Practices in Minnesota with Schools Across the United States Sara Coulter, MPH, RD, Marilyn S. Nanney, PhD, MPH, RD, Cynthia Davey, MS, Sue Lowry, BS, Martha Y. Kubik, PhD, RN, Richard Maclehose, PhD, Toben F. Nelson, ScD University of Minnesota, Minneapolis, MN Secondary school food environment scales Purpose To compare the food environment policies and practices of secondary schools in Minnesota (MN) with a sample of secondary schools across the United States. • Results • MN schools scored: • lower on less healthy vending availability • higher on use of healthy eating strategies • same on prohibited advertisement of less healthy foods • Methods • We developed three scales, based on 19 items from the 2008 School Health Profiles survey, to characterize a school’s food environment. The scales (n = number of items in the scale; α = Chronbach's alpha) we used were: • less healthy vending availability (n=10 items, α=0.75), • use of healthy eating strategies such as pricing healthy items lower than less healthy items (n=5 items, α=0.65) • prohibited advertisement of less healthy foods on buses, newspapers, etc. (n=4 items, α=0.88). • Responses from principals representing 300 MN secondary schools were compared to responses from 6,432 secondary schools from 27 states. • Conclusions • MN schools offer more unhealthy snacks and beverages for purchase by students. • Opportunities to improve MN’s ranking include: • industry support to stock healthier items • strengthening local school wellness policy to address less healthy food availability • developing statewide healthy vending standards for schools participating in the Statewide Health Improvement Program Adjusting for school location (city, suburb, rural/town), percent minority enrollment and percent enrollment in free/reduced price lunch yielded consistent results. Acknowledgements Funding for this study was provided by the RWJF, Healthy Eating Research and New Connections #65056 and NICHHD #1R01HD070738-01