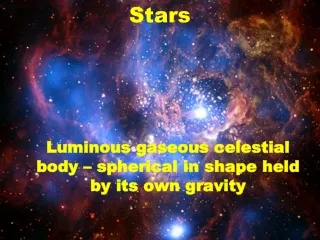
Stars
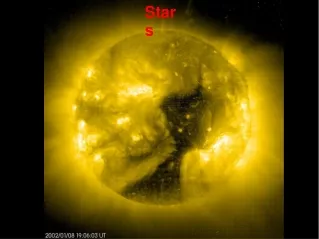
Stars. Introduction To “Atomic Astrophysics and Spectroscopy” (AAS) Anil Pradhan and Sultana Nahar Cambridge University Press 2011 Details at: www.astronomy.ohio-state.edu/~pradhan/Book/book.html. The Sun – X-Ray Image (YOHKOH Satellite).

Stars
E N D
Presentation Transcript
Stars Introduction To“Atomic Astrophysics and Spectroscopy” (AAS) Anil Pradhan and Sultana NaharCambridge University Press 2011 Details at: www.astronomy.ohio-state.edu/~pradhan/Book/book.html
The Sun – X-Ray Image(YOHKOH Satellite) Though the surface temperature of the Sun is 5,770 degrees Kelvin, the Sun is surrounded by very hot gas in the solar corona at more than a million degrees. Solar flares and coronal mass ejections (CMEs) frequently erupt from the Sun emitting intense radiation and charged particles.
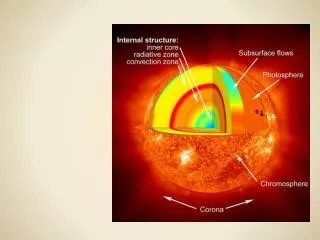
Structure of the Sun: Three ZonesCore, Radiative, Convective • Energy is produced in the core • via thermonuclear reactions and • radiates out through the star • Radiation diffuses through • the Radiative zone via light- • matter interactions • Convection occurs in the outer- • most regions before radiation • emerges through the • stellar atmosphere (not shown)
Brightness and Temperature • Brightness is the total energy emitted, or the luminosity of an object • The luminosity is related to the (blackbody) temperature of the object • L = s T4 (s is a constant) Stefan-Boltzmann Law where T is the temperature in thermal equilibrium (like an oven or a star) • The Sun is nearly a blackbody at 5,550 K (Fig. 10.1, AAS)
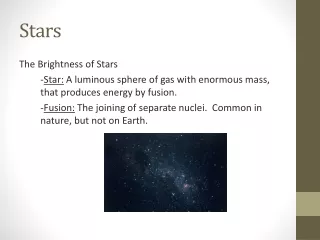
Color Indicates Temperature and Energy of the Source Blackbody: Perfect absorber and emitter of radiation at Temperature T Surface T (Sun) = 5700 K Objects generally emit radiation at all wavelengths, but mostly at one peak wavelength depending on their temperature (e.g. blue – hot, red – cool)
Stars are labeled according to color-temperature-luminosity (O – L)
The Hertzsprung-Russell (HR) Diagram The HR diagram assigns stellar temperature (color) to spectral classes (bottom and top), related to luminosity (left) measured in absolute magnitudes (right)
Luminosity Classes I – V and Spectral Types O-M The Sun is a G2V star
Luminosity vs. Spectral Class (color-temperature):O,B,A,F,G,K,M Thermonuclear fusion drives stellar activity, structure, and properties (Ch. 10-11, AAS). Most stars spend most of their lives on the Main Sequence in the H He “burning” phase, fusion of hydrogen into helium which converts some mass into energy according to the Einstein relation E = mc2 . The Hertzsprung-Russell Diagram
Visible Spectrum: Balmer Series of Absorption Lines of H Hb Ha
Spectrum of a G0 Star: No H, neutral and ionized metals Temperature About 6000K. The Sun is a G2 star. See Fig. 1.1 in AAS on Fraunhofer lines in the Sun, and Fig. 10.3 on G to K spectral types.
Summary of spectral properties of stars(c.f. Table 10.1, AAS) With decreasing T observed spectra reveal Ions Neutral Atoms Molecules