Download
1 / 58
580 likes | 675 Vues
Explore the regulatory systems protecting E. coli from superoxide radicals, crucial for understanding human systems. Investigate metal-ion complexes and Fur concentration on sodA gene expression. Learn to eliminate negative control signaling and optimize DNA band signaling.

E N D
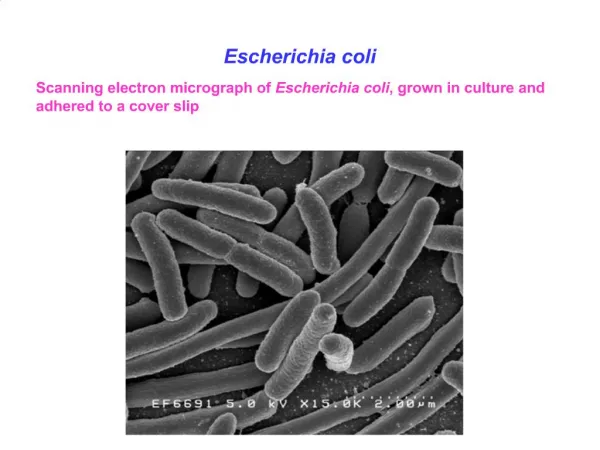
Regulation of Superoxide Radicals in Escherichia coli Sara H. Schilling2007
Overall Goal To learn more about the regulatory systems that protect E. coli bacteria cells from harmful superoxide radicals www.science.howstuffworks.com
Why? Information about protective systems in E. coli can be applied to understand similar systems in humans
Superoxide Radicals in E. coli Fe2+ + O2
Superoxide Radicals in E. coli Fe2+ + O2 Fe3+ + O2• Radicals damage DNA, creating mutations
Breakdown of Superoxide Radicals SOD 2O2 •+ 2H+
Breakdown of Superoxide Radicals SOD 2O2 •+ 2H+ H2O2 + O2
Gene Expression DNA sodA
Gene Expression Transcription DNA mRNA sodA
Gene Expression Transcription Translation DNA mRNA Protein sodA SOD
Protein Regulation sodA gene SOD protein
Protein Regulation Fur sodA gene SOD protein
Previous Research • Fur activates sodA transcription (Schaeffer, 2006)
Previous Research • Fur activates sodA transcription (Schaeffer, 2006) Fur sodA geneMORE SOD protein
Previous Research • Fur activates sodA transcription (Schaeffer, 2006) Fur sodA geneMORE SOD protein • Fur regulates sodA transcription when there are Fe+2 and many superoxide radicals present (Rollefson, et al. 2004)
First Goal To compare activation of sodA transcription in the presence of the three metal-ion complexes of Fur: • Zn1Fur • Zn2Fur • Fe3+Fur
First Hypothesis Based on the research by Rollefson, et al. (2004), I hypothesized that Zn2Fur would be the metal-ion complex of Fur that most activates sodA transcription
Second Goal To determine the effect of Fur concentration on activation of sodA transcription: • 0 nM • 50 nM • 100 nM • 150 nM • 200 nM
Second Hypothesis Based on research by Shaeffer (2006), I hypothesized thatincreased Fur concentration would increase activation of sodA transcription
Third Goal To determine the root of and eliminate the negative control signaling that was present in the Schaeffer study
Third Goal To determine the root of and eliminate the negative control signaling that was present in the Schaeffer study Fourth Goal Tooptimize DNA band signaling by modifying the Schaeffer Protocols
Methods—PCR Polymerase Chain Reaction Diagramed used by permission from K. Shaeffer
Methods—Transcription DNA PCR Purification Transcription in Presence of the Three forms of Fur at Increasing Concentration Negative Controls Constructed mRNA
Methods—Reverse Transcription mRNA Reverse Transcription Negative Controls Constructed cDNA PCR Amplified cDNA
Methods—Gel Electrophoresis Photo by Author
Methods—Visualization Photo by K. Shaeffer used with permission VersaDoc Camera
Results—sodA transcription of Zn1Fur Lane 1-2: sodA transcribed in absence of Zn1Fur, Lane 3-4: sodA transcribed in presence of 50 nM Zn1Fur; Lane 5-6: sodA transcribed in presence of 100 nM Zn1Fur, Lane 7-8: sodA transcribed in presence of 150 nM Zn1Fur, Lane 9-10: sodA transcribed in presence of 0 nM Zn1Fur
Results—sodA transcription of Zn1Fur Lane 1-2: sodA transcribed in absence of Zn1Fur, Lane 3-4: sodA transcribed in presence of 50 nM Zn1Fur; Lane 5-6: sodA transcribed in presence of 100 nM Zn1Fur, Lane 7-8: sodA transcribed in presence of 150 nM Zn1Fur, Lane 9-10: sodA transcribed in presence of 0 nM Zn1Fur
Results—sodA transcription with Fe+3Fur Lane 1-2: sodA transcribed in absence of Fe3+Fur, Lane 3-4: sodA transcribed in presence of 50 nM Fe3+Fur; Lane 5-6: sodA transcribed in presence of 100 nM Fe3+Fur, Lane 7-8: sodA transcribed in presence of 150 nM Fe3+Fur, Lane 9-10: sodA transcribed in presence of 0 nM Fe3+Fur
Results—sodA transcription with Fe+3Fur Lane 1-2: sodA transcribed in absence of Fe3+Fur, Lane 3-4: sodA transcribed in presence of 50 nM Fe3+Fur; Lane 5-6: sodA transcribed in presence of 100 nM Fe3+Fur, Lane 7-8: sodA transcribed in presence of 150 nM Fe3+Fur, Lane 9-10: sodA transcribed in presence of 0 nM Fe3+Fur
Results—sodA Transcription with Zn2Fur Lane 1-2: sodA transcribed in absence of Zn2Fur, Lane 3-4: sodA transcribed in presence of 50 nM Zn2Fur; Lane 5-6: sodA transcribed in presence of 100 nM Zn2Fur, Lane 7-8: sodA transcribed in presence of 150 nM Zn2Fur, Lane 9-10: sodA transcribed in presence of 0 nM Zn2Fur
Results—Negative ControlsInitial Trial • Lanes 1-3: positive controls, Lane 4: negative control (without Master Mix), Lane 5: negative control (without RT primers), Lane 6: empty, Lane 7: negative control (without cDNA), Lanes 8-10: positive controls
Results—Negative ControlsInitial Trial • Lanes 1-3: positive controls, Lane 4: negative control (without Master Mix), Lane 5: negative control (without RT primers), Lane 6: empty, Lane 7: negative control (without cDNA), Lanes 8-10: positive controls No cDNA
Results—Negative ControlsTranscription Assay Components Lane 1: NTP-initiator mixture, Lane 2: RT primer #2, Lane 3: RT primer #3, Lane 4: negative control (without NTP-initiator mixture), Lane 5: negative control (without mRNA), Lane 6: negative control (without DNase), Lane 7: dNTP mixture, Lane 8: positive control • Lane 1-2: empty, Lane 3: DNase, Lane 4: RNA polymerase, • Lane 5: negative control (without DNA), Lane 6: RNase inhibitor, • Lane 7: empty, Lane 8: negative control (without cDNA)
Results—Negative Controls Signaling Components Run with DNase Lane 1: positive control, Lane 2: empty, Lane 3: RNase inhibitor incubated with DNase, Lane 4: NTP-initiator mixture incubated with DNase, Lane 5: 0.5 L RNA polymerase incubated with DNase, Lane 6: 2.0 RNA polymerase incubated with DNase, Lane 7: RNase inhibitor, NTP-initiator mixture, and RNA polymerase incubated with DNase, Lane 8: DNA incubated with DNase
Results—Negative Controls Signaling Components Run with DNase Lane 1: positive control, Lane 2: empty, Lane 3: RNase inhibitor incubated with DNase, Lane 4: NTP-initiator mixture incubated with DNase, Lane 5: 0.5 L RNA polymerase incubated with DNase, Lane 6: 2.0 RNA polymerase incubated with DNase, Lane 7: RNase inhibitor, NTP-initiator mixture, and RNA polymerase incubated with DNase, Lane 8: DNA incubated with DNase Positive Control
Results—Negative Controls Constructed during RT-PCR Lane 1: positive control used in the negative controls (originally run in Figure 9, Lane 1), Lane 2: positive control (originally run in Figure 4, Lane 2), Lane 3: negative control (without mRNA, RT primers 2 and 3, reverse transcriptase, and dNTP mixture), Lane 4: negative control (without RT primers 2 and 3), Lane 5: negative control (without reverse transcriptase), Lane 6: negative control (without mRNA), Lane 7: negative control (without dNTP mixture), Lane 8: negative control (without cDNA), Lane 9: negative control (without Master Mix), Lane 10: negative control (without cDNA or RT primers)
Results—Protocol Optimization PCR Products with Different Concentrations of Primers Lane 4: PCR product containing 4 L of sodA primers; Lane 6: PCR product containing 1 L of sodA primers; Lane 8: PCR product containing 8 L sodA primers
Results—Protocol Optimization PCR Products with Different Concentrations of Primers Lane 4: PCR product containing 4 L of sodA primers; Lane 6: PCR product containing 1 L of sodA primers; Lane 8: PCR product containing 8 L sodA primers 4 L
Results—Protocol Optimization PCR Products with Different Concentrations of Primers Lane 4: PCR product containing 4 L of sodA primers; Lane 6: PCR product containing 1 L of sodA primers; Lane 8: PCR product containing 8 L sodA primers 8 L
Results—Protocol Optimization PCR Products with Different Concentrations of Primers Lane 4: PCR product containing 4 L of sodA primers; Lane 6: PCR product containing 1 L of sodA primers; Lane 8: PCR product containing 8 L sodA primers 1 L
Discussion—First Goal To determine what form of Fur most activates sodA transcription • Hypothesis neither supported nor refuted -sodA transcription in presence of Zn2Fur unsuccessful • Zn1Fur most activated sodA transcription
Future Work—First Goal • Repeat sodA transcription in presence of Zn2Fur • Perform sodA transcription in the presence of other metal-ion complexes of Fur
Discussion—Second Goal To determine the effect of Fur concentration on sodA transcription • Hypothesis correct -Activation of sodA transcription did increase with Fur concentration