Download
1 / 24
240 likes | 256 Vues
This tool focuses on the foundational definitions of quality, data gathering systems, and applications of statistical analysis in Lean and Six Sigma solutions. It discusses the benefits of using data for ongoing improvement, making data-based decisions, reducing nonconformance, and improving communication and problem-solving.

E N D
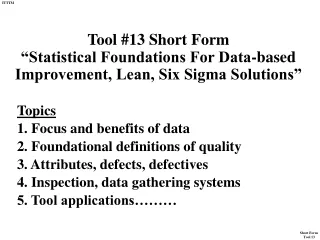
Tool #13 Short Form“Statistical Foundations For Data-based Improvement, Lean, Six Sigma Solutions” Topics 1. Focus and benefits of data 2. Foundational definitions of quality 3. Attributes, defects, defectives 4. Inspection, data gathering systems 5. Tool applications………
Focus And Benefits Of Data • Monitors process for team problem solving • Prevention rather than detection • Knowledge based to modify, adjust, correct • Disciplined approach, ongoing improvement • Uniformity decreases nonconformance • Core communication device • Fewer samples, inspection costs reduced • Provides enhanced measure of capability • Enables data based decisions to be made • Less scrap, rework and other waste
Quality Management Systems (QMS) International Standards Organization (ISO) Synchronous Tools, New Product Development Information Analysis, Communication Systems Enhanced Problem Solving, Decision Making Documentation Tools, Lean Project Team Professional Outcomes, Growth, Knowledge Technological Infrastructure Data Tools, Six Sigma Service, Tools Manufacturing, Non- Manufacturing Applied Research, Project Structure Internal, External, E-commerce Relationships Cultural Change And Continuous Improvement Industrial Technologists’ Toolkit For Technical Management Focus And Benefits Of Data
Focus And Benefits Of Data Characteristics And Standards Identification, Evaluation Standard Deviation, SPC Data Collected Documentation, Process Control By Operators Using SOP Brainstorming For Corrective Action Ongoing Improvement In Teams Basic Relationships In Data, SPC, Teams, Documentation, Improvement
Focus And Benefits Of Data Sampling Capability Bar And Pie Disciplined Attribute Data Conformance Studies And Charts, Paretos, Problem Solving To Standards Gage R & R Graphs Characteristics Standard In-process Control By Operators Via Forms, SOP’s Ongoing Brainstorming For Corrective Action And Standards Deviation, Improvement Identification, SPC Data Teams Evaluation Collected Cost Reduction, Cause/Effect, Failure Mode And Effects Analysis (FMEA) Tracking, SOP’s, Ongoing Process Control Plan (OPCP) Enhanced Collecting Data, Variable Data Communication, Short/Long Runs Competitiveness Expanded Relationships In Data, SPC, Teams, Documentation, Improvement.
46 X = = 4.6 10 Foundational Definitions Of Quality Range Range = 20 - 4 R = 16 Mean 3, 3, 4, 4, 5, 5, 5, 5, 6, 6
Foundational Definitions Of Quality • +/- 1 standard deviation, 68% of population • +/- 2 standard deviation, 95% of population • +/- 3 standard deviation, 99.7% of population Nominal Lower Spec Limit Upper Spec Limit 68.26% 95.46% 99.73% -3 s -2 s -1 s 1 s 2 s 3 s Normal Curve, Standard Deviation
Foundational Definitions Of Quality • Variation: range; variance; standard deviation • Variance is square of standard deviation • Broader look, range, behavior around mean • Standard deviation is total variation at mean Nominal Lower Spec Limit Upper Spec Limit 68.26% 95.46% 99.73% -3 s -2 s -1 s 1 s 2 s 3 s Normal Curve, Standard Deviation
Foundational Definitions Of Quality Normal Curve, Standard Deviation Example calculation of standard deviation: Data 5, 6, 7, 6, 8 n = 5 X = 6.4 2 List the Xi List Xi - X List (Xi - X) 5 - 1.4 1.96 6 - 0.4 0.16 7 0.6 0.36 6 - 0.4 0.16 8 1.6 2.56 Sum ( ) 5.20
s, = 2 2 ∑(Xi - X) = ∑ (Xi - X) n -1 n -1 s, = 5.20 4 1.30 s, = s, = 1.14 Foundational Definitions Of Quality Normal Curve, Standard Deviation The formula for sample standard deviation is: s, = “the sum of” Xi = individual measures X = average n = sample size s, standard deviation
Foundational Definitions Of Quality • Central Tendancy • Mean or average • Mode or most • Median or position • Inferential Statistics • Inferences in data • Probabilities • Descriptive Statistics • Distribution • Range, highs to lows • Tolerance, acceptance range • Defects • Non-functional • Non-conforming • Varies from specification • Defect may not spoil product • Defect, unacceptable product • Judged as unfit for use • Defective • Multiple defects • Unacceptable or acceptable • Depends on severity • Customer demands
Attributes, Defects, Defectives • Attributes Defined • Not measurable • Good or bad • Judgement calls • May not be gaged • Obvious characteristics • Go, no-go gages • Attribute Examples • Appearance • Texture, touch • Color coordinates • General fit • Variable Defined • Measurable, such as diameter • Discreet differences • Variation defined precisely • Instrumentation • Defined, detailed characteristics • Objectivity is goal • Variable Examples • Diameter • Length • Cloth density • Surface finish
Attributes, Defects, Defectives Shifting Attribute To Variable Data
Attributes, Defects, Defectives Documentation, Determine Improvement Consistency, Analyze, Capability Assess Process Provide, Pursue Characteristics, Compare Benchmark Charting, Data, Characteristics Data Foundations Vendor Certification, Evaluate For Communication Standard Baseline For Procedures Adjustments Attributes As Broad Foundational Characteristics’ Relationships.
Inspection, Data Gathering Systems Attributes Identified, Inspection, Start For Charting • Quality characteristics are important features • Defined by customer • Refined by engineering and design groups • Variable or attribute data • Explained in context of print, notes • Characteristics may be ranked by importance • Goal is to further define a characteristic • Use characteristic as a measure for quality • Continuously evaluating characteristics • Shift from attribute to variable data over time
Inspection, Data Gathering Systems Histograms, Bar, Pie, Pareto Charts, Checklists
Inspection, Data Gathering Systems Histograms, Bar, Pie, Pareto Charts, Checklists ……Forms The Base For The Inspection System
Inspection, Data Gathering Systems Attributes Identified, Inspection, Start For Charting
Tool Applications……. • Toolkit applications are a key part of the courseware • Located in separate folder of the CD • Provides the template for team portfolio • Each application s part of team project, portfolio • Designed to be done by all, each team member • First read long form, then short review, applications • Total contribution in application form is compiled • Portfolio is gradually evolved around applications • Tool 13 applications are: • VSPC, introduced, continuously built, not just at start • PASPC also introduced, built gradually, evolved • Documentation System Design, Communication, DSDC • ISOQSAOPP, designed to help set a plan for team • GOTA, vacabulary, glossary of terms • All follow through, do and post, independently
Tool Applications……. • P-Attribute Statistical Process Control (PASPC) • First logical step for SPC, based on attributes • Interactive with GSIC, integrated systems • Inspect, track attributes as key characteristics • Do key statistical analysis, charting around on this • Analysis tool for improvement, leads to variable data • Partial table below is start for collection, calculation
Tool Applications……. • Variable Statistical Process Control (VSPC) • Interactive with, base for, most other statistical systems • Inspect, track key characteristics, document process • Do key statistical analysis, charting around on this • Analysis tool for improvement, leads to variable data • Partial table starts continuous development in project
Tool Applications……. • Glossary Of Terms, Applications (GOTA) • Continuously added to over entire course, by all • Helps enhance vocabulary, get all on same page • Terms are in toolkit, various parts, not just this course • A sampling of the form (partial) is shown……..
Tool Applications……. • ISO/QS Audit, Objective Prioritization Plan (ISOQSAOPP) • Preliminary plan, setup of assessments, work for team • Familiarize with ISO, auditing, all on same page, terms • Strategic planning, team level, change and improvement • Project 50% done when “problem” nailed down • “hot spots” focus, project objectives, gradually PPDPOA • Gantt from SDA form or template, for time, sequence • Partial form is shown……..
Tool Applications……. • Documentation System Design, Communication (DSDC) • Initial design, plan for how the team will work • Given that all work is about communications……. • Documentation is blackboard is critical • Must consider initially how this will happen, DSDC • DSDC provides opportunity to reflect on, discuss