Financial Analysis Supplement: Future Value, Present Value, Annuities & Depreciation
240 likes | 359 Vues
Understand financial analysis concepts like future value, present value, annuities, and depreciation with practical applications and formulas. Learn how to calculate investment values over time and make informed financial decisions.

Financial Analysis Supplement: Future Value, Present Value, Annuities & Depreciation
E N D
Presentation Transcript
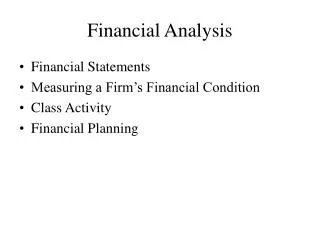
Financial Analysis Supplement J
where F = future value of the investment at the end of n periods P = amount invested at the beginning, called the principal r = periodic interest rate r = number of time periods for which the interest compounds Future Value of an Investment The value of an investment at the end of the period over which interest is compounded. F = P(1 + r)n
Application J.1 Future Value of a $500 Investment in 5 Years 500(1 + .06)5 = 500(1.338) = $669.11
F (1 + r)n P = where F = future value of the investment at the end of n periods P = amount invested at the beginning, called the principal r = periodic interest rate (discount rate) r = number of time periods for which the interest compounds Present Value of a Future Amount The amount that must be invested now to accumulate to a certain amount in the future at a specific interest rate.
Application J.2 Present Value of $500 Received in Five Years 500/1.338 = $373.63
1 (1 + r)n 1 (1 + r)n F (1 + r)n P = = F = present value factor (or pf) Present Value Factors
Present Value Factors for a Single Payment Number of Interest Rate (r) Periods (n) 0.01 0.02 0.03 0.04 0.05 0.06 0.08 0.10 0.12 0.14 1 0.9901 0.9804 0.9709 0.9615 0.9524 0.9434 0.9259 0.9091 0.8929 0.8772 2 0.9803 0.9612 0.9426 0.9246 0.9070 0.8900 0.8573 0.8264 0.7972 0.7695 3 0.9706 0.9423 0.9151 0.8890 0.8638 0.8396 0.7938 0.7513 0.7118 0.6750 4 0.9610 0.9238 0.8885 0.8548 0.8227 0.7921 0.7350 0.6830 0.6355 0.5921 5 0.9515 0.9057 0.8626 0.8219 0.7835 0.7473 0.6806 0.6209 0.5674 0.4194 6 0.9420 0.8880 0.8375 0.7903 0.7462 0.7050 0.6302 0.5645 0.5066 0.4556 7 0.9327 0.8706 0.8131 0.7599 0.7107 0.6651 0.5835 0.5132 0.4523 0.3996 8 0.9235 0.8635 0.7894 0.7307 0.6768 0.6274 0.5403 0.4665 0.4039 0.3506 9 0.9143 0.8368 0.7664 0.7026 0.6446 0.5919 0.5002 0.4241 0.3606 0.3075 10 0.9053 0.8203 0.7441 0.6756 0.6139 0.5584 0.4632 0.3855 0.3220 0.2697 Present Value Factors (pf)
F (1 + r)n F (1 + r)n+1 P = + + … Annuities A series of payments on a fixed amount for a specified number of years. or P = A (af) where P = present value of an investment A = amount of the annuity received each year af = present value factor for an annuity
Present Value Factors of an Annuity Number of Interest Rate (r) Periods (n) 0.01 0.02 0.03 0.04 0.05 0.06 0.08 0.10 0.12 0.14 1 0.9901 0.9804 0.9709 0.9615 0.9524 0.9434 0.9259 0.9091 0.8929 0.8772 2 1.9704 1.9416 1.9135 1.8861 1.8594 1.8334 1.7833 1.7355 1.6901 1.6467 3 2.9410 2.8839 2.8286 2.7751 2.7732 2.6730 2.5771 2.4869 2.4018 2.3216 4 3.9020 3.8077 3.7171 3.6299 3.5460 3.4651 3.3121 3.1699 3.0373 2.9137 5 4.8534 4.7135 4.5797 4.4518 4.3295 4.2124 3.9927 3.7908 3.6048 3.4331 6 5.7955 5.6014 5.4172 5.2421 5.0757 4.9173 4.6229 4.3553 4.1114 3.8887 7 6.7282 6.4720 6.2303 6.0021 5.7864 5.5824 5.2064 4.8684 4.5638 4.2883 8 7.6517 7.3255 7.0197 6.7327 6.4632 6.2098 5.7466 5.3349 4.9676 4.6389 9 8.5660 8.1622 7.7861 7.4353 7.1078 6.8017 6.2469 5.7590 5.3282 4.9464 10 9.4713 8.9826 8.3302 8.1109 7.7217 7.3601 6.7201 6.1446 5.6502 5.2161 Present Value Factors (af)
Interest Rate (r) (n)0.06 0.08 0.10 0.12 0.14 1 0.9434 0.9259 0.9091 0.8929 0.8772 2 1.8334 1.7833 1.7355 1.6901 1.6467 3 2.6730 2.5771 2.4869 2.4018 2.3216 4 3.4651 3.3121 3.1699 3.0373 2.9137 5 4.2124 3.9927 3.7908 3.6048 3.4331 Present Value Factor (af) for Application J.3
Application J.3 Present Value of a $500 Annuity for 5 Years P = A (af) A = $500 for 5 years at 6% af = 4.2124 (from table) P = 500(4.2124) = $2,106.20
I – S n D = where D = annual depreciation I = amount of investment S = salvage value n = number of years of project’s life Straight-Line Depreciation
Modified Accelerated Cost Recovery System (MACRS) 3-year class: tools and equipment used in research 5-year class: autos, copiers, and computers 7-year class: industrial equipment and office furniture 10-year class: longer-life equipment
Modified ACRS Depreciation Allowances Class of Investment Year 3-Year 5-Year 7-Year 10-Year 1 33.33 20.00 14.29 10.00 2 44.45 32.00 24.49 18.00 3 14.81 19.20 17.49 14.40 4 7.41 11.52 12.49 11.52 5 11.52 8.93 9.22 6 5.76 8.93 7.37 7 8.93 6.55 8 4.45 6.55 9 6.55 10 6.55 11 3.29 100.0% 100.0% 100.0% 100.0% Modified Accelerated Cost Recovery System (MACRS) 3-year class: tools and equipment used in research 5-year class: autos, copiers, and computers 7-year class: industrial equipment and office furniture 10-year class: longer-life equipment
YEAR ITEM 2008 2009 2010 2011 2012 2013 2014 Initial Information Annual demand (salads) 11,000 11,000 11,000 11,000 11,000 Investment $16,000 Interest (discount) rate 0.14 Cash Flows Revenue $38,500 $38,500 $38,500 $38,500 $38,500 Expenses: Variable costs 22,000 22,000 22,000 22,000 22,000 Expenses: Fixed costs 8,000 8,000 8,000 8,000 8,000 Depreciation (D) 3,200 5,120 3,072 1,843 1,843 922 Pretax income $5,300 $3,380 $5,428 $6,657 $6,657 – $922 Taxes (40%) 2,120 1,352 2,171 2,663 2,663 – 369 Net operating income (NOI) $3,180 $2,208 $3,257 $3,994 $3,994 – $533 Total cash flow (NOI + D) $6,380 $7,148 $6,329 $5,837 $5,837 $369 Example J.1Calculating After-Tax Cash Flows Local restaurant considering the addition of a salad bar:
Example J.2 Calculating NPV 2009: $ 6,380(0.8772) = $ 5,597 2010: $ 7,148(0.7695) = $ 5,500 2011: $ 6,329(0.6750) = $ 4,272 2012: $ 5,837(0.5921) = $ 3,456 2013: $ 5,837(0.5194) = $ 3,032 2014: $ 369(0.4556) = $ 168 NPV = ($5,597 + $5,500 + $4,272 + $3,456 + $3,032 + $168) – $16,000 NPV = $6,024
IRR by Trial and Error Discount Rate NPV 14% $ 6,025 18% $ 4,092 22% $ 2,425 26% $ 977 30% – $ 199 28% $ 322 Example J.2Calculating IRR 2009: $ 6,380(0.8772) = $ 5,597 2010: $ 7,148(0.7695) = $ 5,500 2011: $ 6,329(0.6750) = $ 4,272 2012: $ 5,837(0.5921) = $ 3,456 2013: $ 5,837(0.5194) = $ 3,032 2014: $ 369(0.4556) = $ 168 NPV = ($5,597 + $5,500 + $4,272 + $3,456 + $3,032 + $168) – $16,000 NPV = $6,024
Payback Period YEAR ITEM 2001 2002 2003 2004 2005 2006 2007 Add after-tax cash flows to get as close as possible to without exceeding the initial investment ($16,000) Initial Information Annual demand (salads) 11,000 11,000 11,000 11,000 11,000 Investment $16,000 Interest (discount) rate 0.14 Cash Flows Revenue $38,500 $38,500 $38,500 $38,500 $38,500 Expenses: Variable costs 22,000 22,000 22,000 22,000 22,000 Expenses: Fixed costs 8,000 8,000 8,000 8,000 8,000 Depreciation (D) 3,200 5,120 3,072 1,843 1,843 922 Pretax income $5,300 $3,380 $5,428 $6,657 $6,657 – $922 Taxes (40%) 2,120 1,352 2,171 2,663 2,663 – 369 Net operating income (NOI) $3,180 $2,208 $3,257 $3,994 $3,994 – $533 Total cash flow (NOI + D) $6,380 $7,148 $6,329 $5,837 $5,837 $369 $6,380 + $7,148 = $13,528 (2009 and 2010) $16,000 – $13,528 = $2,472 (remainder for 2010) $2,472/$6,329 = 0.39 (portion of 2010 required) Payback Period = 2.39 years Example J.2Calculating Payback Period
OM ExplorerFinancial Analysis Solver Salad Bar example:
NPV for ProjectApplication J.4 Year 1: $500 Year 2: $650 Year 3: $900 The discount rate is 12%, and the initial investment is $1,550, so the project’s NPV is: Present value of investment (Year 0): ($1,550.00) Present value of Year 1 cash flow: 446.40 Present value of Year 2 cash flow: 518.18 Present value of Year 3 cash flow: 640.62 Project NPV: $ 55.20