
Jarrett-2: Answer Sheet
Name:. Jarrett-2: Answer Sheet. ANSWERING BAR GRAPH QUESTIONS 5. What was the population of Africa in 1650? Less than 25 million 50 million 100 million 250 million 6. Which statement is supported by information from the graph?

Jarrett-2: Answer Sheet
E N D
Presentation Transcript
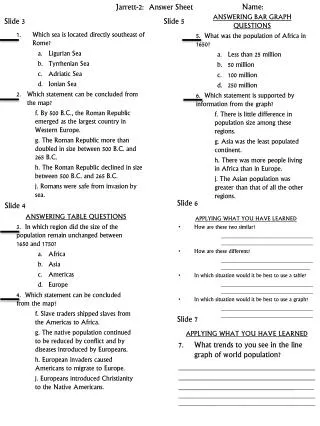
Name: Jarrett-2: Answer Sheet ANSWERING BAR GRAPH QUESTIONS 5. What was the population of Africa in 1650? • Less than 25 million • 50 million • 100 million • 250 million 6. Which statement is supported by information from the graph? f. There is little difference in population size among these regions. g. Asia was the least populated continent. h. There was more people living in Africa than in Europe. j. The Asian population was greater than that of all the other regions. Slide 3 Slide 5 • Which sea is located directly southeast of Rome? • Ligurian Sea • Tyrrhenian Sea • Adriatic Sea • Ionian Sea • Which statement can be concluded from the map? f. By 500 B.C., the Roman Republic emerged as the largest country in Western Europe. g. The Roman Republic more than doubled in size between 500 B.C. and 265 B.C. h. The Roman Republic declined in size between 500 B.C. and 265 B.C. j. Romans were safe from invasion by sea. Slide 6 Slide 4 ANSWERING TABLE QUESTIONS 3. In which region did the size of the population remain unchanged between 1650 and 1750? • Africa • Asia • Americas • Europe 4. Which statement can be concluded from the map? f. Slave traders shipped slaves from the Americas to Africa. g. The native population continued to be reduced by conflict and by diseases introduced by Europeans. h. European invaders caused Americans to migrate to Europe. j. Europeans introduced Christianity to the Native Americans. APPLYING WHAT YOU HAVE LEARNED • How are these two similar? _______________________________ _______________________________ • How are these different? _______________________________ ______________________________ • In which situation would it be best to use a table? _______________________________ _______________________________ • In which situation would it be best to use a graph? _______________________________ _______________________________ Slide 7 APPLYING WHAT YOU HAVE LEARNED • What trends to you see in the line graph of world population? ________________________________________________________________________________________________________________________________________________________________________________________
Jarrett-2: Answer Sheet pg. 2 Slide 8 Slide 10 ANSWERING LINE GRAPH QUESTIONS 8. Which period showed the greatest increase in world population? • From 20,000 to 15,000 years ago • From 15,000 to 10,000 years ago • From 10,000 to 5,000 years ago • From 5,000 to 2,500 years ago 9. Which best describes the general trend of world populations growth since the introduction of farming? f. World population has continued to increase, but not as rapidly as when farming was introduced.. g. The greatest growth in world population occurred during the hunting and gathering period. h. World population has generally decreased since the introduction of farming.. j. World population has increased dramatically since the introduction of faming. ANSWERING DIAGRAM QUESTIONS 12. Based on the information in the diagram, which statement is correct? • Samurai were the main owners of large estates in Japan • Samurai were loyal to their daimyo • The shogun had an equal social rank with the emperor • Daimyos made up the most populous group in Japanese society 13. What conclusion can best be reached from the information in the diagram? f. The Shogun enjoyed a higher social rank than the Emperor g. Merchants were the most respected social class in Japan h. The Shogun actually ruled over Japan during this period j. Social relations in Japan during this period were based on equality Slide 11 ANSWERING TIMELINE QUESTIONS 14. Which statement is most accurate based on the information in the timeline? • The Ottoman Turks successfully invaded Constantinople in 1453. • Mohammed was born in the same year that the Crusades ended. • The first Crusaders invaded the Holy Land in 1291. • The Abbasid Caliphate was founded in 520. 15. What conclusion can be drawn from the information in the timeline? f. Between 520 and 1453, most events involved attempts to achieve peace. g. The period between 520 and 1453 saw the rise of Islam in the Middle East h. The Crusades ended before Mohammed founded Islam j. The Crusaders invaded the Holy Land in the fourteenth century Slide 9 ANSWERING CIRCLE GRAPH QUESTIONS 10. Which was the largest non-voting group in ancient Athens? • Wives of citizens • slaves • Children of citizens • foreigners 11. What conclusion about Athens can be drawn from the circle graph? f. Athens was the populous city-state of ancient Greece g. Athenians enjoyed living in their city-state h. Foreigners made up the largest group in ancient Athens j. Most Athenians were barred from voting in elections
Jarrett-2: Answer Sheet pg. 3 Slide 12 TABLE GRAPH BAR GRAPH
Jarrett-2: Answer Sheet pg. 4 Slide 12 CIRCLE GRAPH EXTRA CREDIT: TIMELINE or DIAGRAM