Graphing Square Root and Cube Root Functions: Understanding Parent Functions
This lesson focuses on graphing the square root and cube root functions using the concept of parent functions. We will explore the characteristics of these functions, such as vertices and key points, while learning how to identify their domains and ranges. Students will engage in hands-on activities by graphing specific functions on a coordinate plane, with emphasis on recognizing how each function behaves. By collaborating in groups, students will graph, identify critical points, and discuss domain and range for both square root and cube root functions.

Graphing Square Root and Cube Root Functions: Understanding Parent Functions
E N D
Presentation Transcript
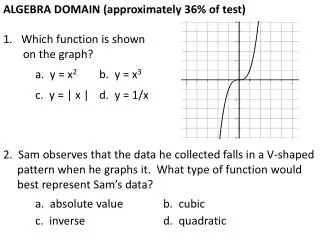
What do the “Parent Functions” look like? Graph the functions on a coordinate plane: We will focus on these points to graph each cube root function.
What to look for when graphing: or (h,k) is the “Vertex” a determines the next point(s)-almost like the slope of the radical function. (h,k)
What About the Domain and Range? or For Cube Root Functions: Domain: All Real Numbers Range: All Real Numbers ALWAYS For Square Root Functions: Domain: Range: if a >0 if a <0
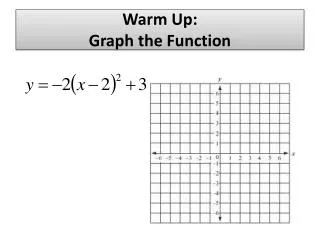
Graph the Given function, then state the Domain and the Range. Domain: Range: Can also be written as:
Graph the Given function, then state the Domain and the Range. a = - ½ (h,k) = (4,2) Domain: All Real Numbers Range: All Real Numbers Can also be written as:
In Groups of 3-4 Graph pg. 434# 4-12 even Each Group will draw a graph on the board -1 person graphs the “Vertex” -1 person graphs the next point(s) -1 person draws the curve -1 person lists the Domain, Range