Download

1 / 17
170 likes | 289 Vues
This review delves into the fundamentals of graphing functions on the Cartesian plane, introducing essential concepts including the definition of a function, linear functions in the form ( y = mx + b ), and quadratic functions represented as ( y = ax^2 + bx + c ). It explores various examples, transformations, and the Vertical Line Test to determine function validity. Additionally, the text covers the significance of slope and y-intercept in linear equations and discusses how coefficients influence the shape and position of quadratic graphs.

E N D
Cartesian Plane (2,5) (-4,3) (-7,-7) (1,-3)
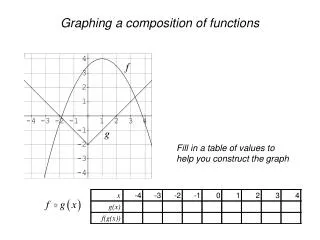
What is a function? y x y = mx + b f(x) = ln (x+5) y = ax2 + bx + c f(x) = sin x g(x) = ex
Linear Functions y = mx + b slope y-intercept y = 2x + 3 y = 3x - 4 y = -(1/2)x
Linear Functions y = 4 x = 2
Quadratic Functions y = ax2 +bx + c y = x2
Quadratic Functions y = x2 - 2x + 1
Quadratic Functions y = x2 - 2x + 2
y = ax2 + bx + c or + - y = x2 y = -x2
y = ax2 + bx + c changes width of parabola y = x2 y = 2x2 y = .5x2
y = ax2 + bx + c moves parabola up or down y = x2 + 2x + 1 y = x2 + 2x y = x2 + 2x - 1
f(x+a) y = x2 + 2x + 1 y = (x+1)2 + 2(x+1) + 1
f(x+a) y = x2 + 2x + 1 y = (x+1)2 + 2(x+1) + 1
Graph Transformations y = ± x2 y = ax2 + bx + c y = ax2 + bx + c y = (x+h)2 + (x+h) + c
Free Graphing Calculator Graphing Calculator by Mathlab