Download
1 / 22
250 likes | 888 Vues
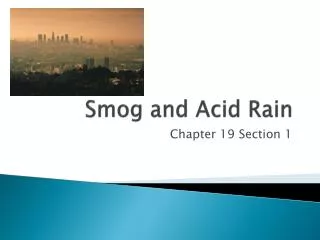
Smog, Thermal Inversions, and Acid Deposition. Lecture 10.2 Chapter 15. SMOG. The VOC problem. Point: the VOC’s react with the NO! so the NO is not available to react with ozone and reverse the daytime reaction. Photochemical Smog. Sources of Smog in L.A. Normal Conditions.

E N D
Smog, Thermal Inversions, and Acid Deposition Lecture 10.2 Chapter 15
The VOC problem • Point: the VOC’s react with the NO! • so the NO is not available to react with ozone and reverse the daytime reaction.
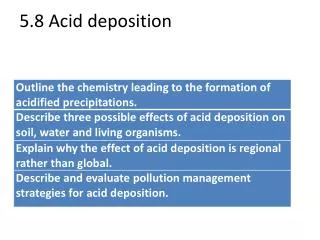
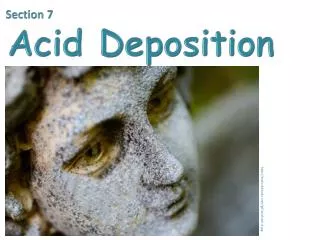
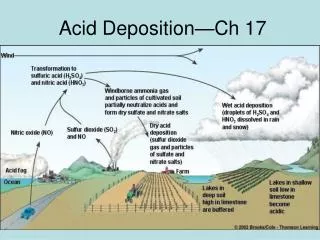
Acid Deposition • Acids that return to the surface as either dry or wet deposition • pH scale NOTE: pH of rainwater is 5.6 since CO2 + H2O H2CO3
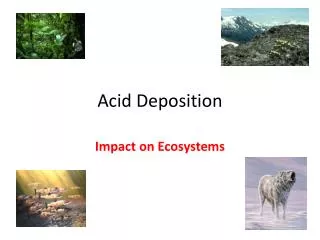
Effects of Acid Deposition • (1) Declining Aquatic Animal Populations • (2) Thin-shelled eggs prevent bird reproduction • Because calcium is unavailable in acidic soil • (3) Forest decline • Ex: Black forest in Germany (50% is destroyed)
APES Theme • The solubility of heavy metals increases with DCREASING pH
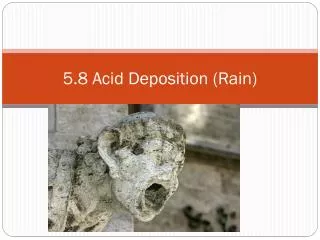
(4) Damage to Buildings Acids react with limestone or marble CaCO3 + HNO3 CaCO3 + H2SO4
The diagram represents the pH ranges in which selected aquatic organisms exist. The solid figures represent pH ranges in which the organism thrives. The shaded figures represent pH ranges in which conditions are less favorable, but in which the organism thrives. No symbol is placed in a pH range in which that organism cannot survive.
Determine the pH range in which brook trout thrive. What range of hydrogen-ion concentration, [H+], does this pH range correspond?
Which organism(s) might best provide an indication that a a lake has changed from pH 5.8 to pH 5.2? Explain.
Discuss how pH affects biodiversity in a freshwater community. Consideri) chemical, ii) physiological, and iii) ecological factors in your answer.
It is known that lake acidification is problematic in the Northeastern, US, describe potential ways to avoid or remediate it.