Acid Rain Deposition and Sources
100 likes | 353 Vues
Acid Rain Deposition and Sources. A look into the independent variables that influence deposition of NO 3 in the Northeastern U.S. Alex Geller 11/29/06. Purpose/Goals. To calculate a formula to predict acid rain deposition across the Northeastern U.S. based on three variables: Elevation

Acid Rain Deposition and Sources
E N D
Presentation Transcript
Acid Rain Deposition and Sources A look into the independent variables that influence deposition of NO3 in the Northeastern U.S. Alex Geller 11/29/06
Purpose/Goals • To calculate a formula to predict acid rain deposition across the Northeastern U.S. based on three variables: • Elevation • Distance from a pollution point source. • Annual power plant emissions
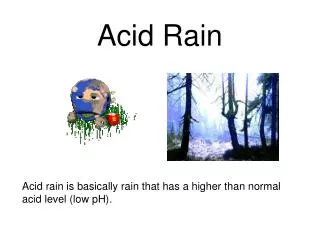
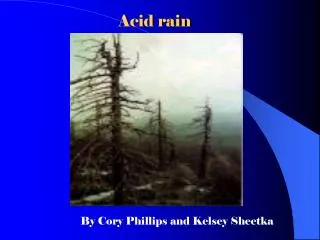
Overview of Acid Rain • Produced mainly by power plants and motor vehicles. • Emissions of SO2 and NOX. • Water is precipitated back to the earth slightly acidic. • Effects are felt throughout the plant and animal wildlife.
Download and project wet deposition stations DBF throughout the NE (NADP/NTN). Join emissions values DBF (EPA-C-MAP) from each US state to a US base map and categorize. Pick 5 dirtiest states from the Ohio valley dissolve boundaries and calculate a centroid location. Join wet deposition stations to centroid to determine distance. Project NE DEM (USGS) to determine the elevation of each deposition station. Use Statistical analysis program (SPSS) to create an explanatory linear regression (enter) model of NO3 deposition. Methods/Sources
Wet Deposition Collection Stations -Wet deposition Stations projected with NO3 concentration values
State Emission Values -Join preformed on NE US base map to combine emissions values. -Kentucky, Pennsylvania, Ohio, Indiana, and West Virginia recognized as “Dirtiest States”.
Pollution Centroid - The 5 “Dirty States” were dissolved to produce 1 polygon and a centroid value was calculated to determine relative wet dep station distances.
Findings NO3 Deposition (Mg/L) NOX Deposition (Mg/L) Distance (m) NOX Emissions (tons) NOx emissions vs deposition concentration. (T=3.751, P<.0005) 1990 avg=1.38 Mg/L, 1999 avg=1.15 Mg/L NOx distance vs. deposition concentration. (r2=.591, p<.0005) NO3 = 1.256 + 4.656E-7(emission(tons)) – 1.026E-6(distance(km))(F=53.333, P<0.0005)
Deposition Over the Years 1990 2,061,043 tons 1999 1,565,489 tons Future 1,000,000 tons
Learned Acid rain is related to distance and power plant emissions. Elevation is a poor predictor of acid rain likely due to climatic effects. Rain shadow effect Lake effect Next Time Account for more variables such as: wind direction and speed, vehicle exhaust emissions, SOx emissions, raster rain deposition model (not elevation) Conclusion