Download
1 / 27
280 likes | 310 Vues
Explore the latest Z-Score Neurofeedback advances by learning about Individual Z-Scores, Range Training, PZOK, and more. Dive into Z-Motive, Z-Mean, Z-Bars, and Planetary Analogy for enhanced training and visualization. Discover how Z-Plus transforms brain dynamics and addresses outliers effectively.

E N D
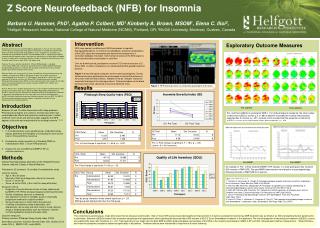
New Directions in Live Z-Score Neurofeedback Thomas F. Collura, Ph.D. BrainMaster Technologies, Inc. August 11, 2010
Current LZT Methods • Individual Z-Scores • Range Training • Multiple Range Training • PZOK
Current Status • PZOK can train “inliers” or “outliers” • Narrow Targets, low percentage = challenge – ignores outliers • Wide Targets, high percentage = non-challenge – emphasizes outliers
Motivation for Z-Plus • Continue with PZOK, add new capability • Train outliers by their tendency to move inward • Monitor global tendency toward normal • Watch z-scores in action
Z-Plus • Z-Motive • Z-Mean • Z-Bars • Z-Maps
Z-Motive • Measures instantaneous change in all z-scores outside the targets • Negative (<0) if z-scores are moving away • Positive (>0) if z-scores are moving toward normal • Maximum value = 100 if all z-scores suddenly go inside their targets • “Tendency to normalize”
Z-Mean • Mean (absolute value) distance of all z-scores that are outside targets • Reflects average size of all outlying z-scores • Typical value: 2.0 – 4.0. • Changes “slowly” • “How abnormal are we?”
Z-Bars • Shows each and every Z-Score in two forms • One: Bar graph showing average (damped) value • Two: line and dot showing most recent change • Allows use to visualize all Z-Scores at once • See which Z-Scores are important
Planetary Analogy • Targets = “sun” • Z-Scores = “planets” • PZOK = “how many planets are within the defined range • PZMO = “what is the tendency to move inward” (gravity) • PZME = “how far are they on average (size of solar system) • GOAL: A compact (normal) solar system
Z-Plus - Summary • New metrics to guide and assess training • New displays to visualize changes • Enhanced visibility of brain dynamics • Addresses Outliers directly • Addresses Global level of normality • Appeals to notion of z-scores as “planets” and normality as “gravity”