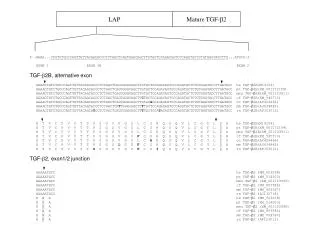

LAP
E N D
Presentation Transcript
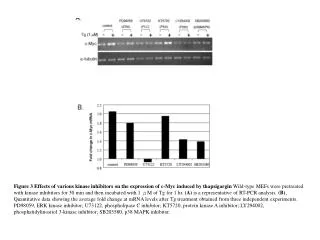
Figure 3 Effects of various kinase inhibitors on the expression of c-Myc induced by thapsigargin Wild-type MEFs were pretreated with kinase inhibitors for 30 min and then incubated with 1 μM of Tg for 1 hr. (A) is a representative of RT-PCR analysis. (B), Quantitative data showing the average fold change at mRNA levels after Tg treatment obtained from three independent experiments. PD98059, ERK kinase inhibitor; U73122, phospholipase C inhibitor; KT5720, protein kinase A inhibitor; LY294002, phosphatidylinositol 3-kinase inhibitor; SB203580, p38 MAPK inhibitor.
Fed Fasted KO KO KO KO KO KO KO WT WT WT WT WT KO WT Tubulin ? LAP Alb-Cre mouse liver 3mo old
Amino Acid Deprivation Induces the Transcription Rate of the Human Asparagine Synthetase Gene through a Timed Program of Expression and Promoter Binding of Nutrient-responsive Basic Region/Leucine Zipper Transcription Factors as Well as Localized Histone Acetylation* Hong Chen‡, Yuan-Xiang Pan‡, Elizabeth E. Dudenhausen, and Michael S. Kilberg§ From the Department of Biochemistry and Molecular Biology, Genetics Institute, and Shands Cancer Center, University of Florida College of Medicine, Gainesville, Florida 32610 Expression of human asparagine synthetase (ASNS), which catalyzes asparagine and glutamate biosynthesis, is transcriptionally induced following amino acid deprivation. Previous overexpression and electrophoresis mobility shift analysis showed the involvement of the transcription factors ATF4, C/EBP, and ATF3-FL through the nutrient-sensing response element-1 (NSRE-1) within the ASNS promoter. Amino acid deprivation caused an elevated mRNA level for ATF4, C/EBP, and ATF3-FL, and the present study established that the nuclear protein content for ATF4 and ATF3-FL were increased during amino acid limitation, whereas C/EBP-LIP declined slightly. The total amount of C/EBP-LAP protein was unchanged, but changes in the distribution among multiple C/EBP- LAP forms were observed. Overexpression studies established that ATF4, ATF3-FL, and C/EBP-LAP could coordinately modulate the transcription from the human ASNS promoter. Chromatin immunoprecipitation demonstrated that amino acid deprivation increased ATF3-FL, ATF4, and C/EBPbinding to the ASNS promoter and enhanced promoter association of RNA polymerase II, TATA-binding protein, and TFIIB of the general transcription machinery. A time course revealed a markedly different temporal order of interaction between these transcription factors and the ASNS promoter. During the initial 2 h, there was a 20-fold increase in ATF4 binding and a rapid increase in histone H3 and H4 acetylation, which closely paralleled the increased transcription rate of the ASNS gene, whereas the increase in ATF3-FL and C/EBPbinding was considerably slower and more closely correlated with the decline in transcription rate between 2 and 6 h. The data suggest that ATF3-FL and C/EBPact as transcriptional suppressors for the ASNS gene to counterbalance the transcription rate A). Overexpression of a cDNA encoding C/EBP -LAP and -LIP was used to identify the migration of these two isoforms (not shown). C/EBP -LAP migrated as three primary bands, as described under “Results,” so each band was quantified separately. A and C shows representative autoradiograms, whereas the graphs in B and D are the summary of three independent experiments, from which the data are depicted as the averages S.D.
C-myc Egr-1