Transport Mechanisms
The cardiac cycle represents the sequence of contraction (systole) and relaxation (diastole) of the heart during a single heartbeat, lasting approximately 0.8 seconds at a rate of 75 beats per minute. It involves distinct phases, including atrial and ventricular systole and diastole, characterized by pressure changes as the AV and SL valves open and close, producing heart sounds (lubb and dubb). The sino-atrial node serves as the heart's pacemaker, coordinating the electrical impulses through the conduction system, which is crucial for effective heart functioning. An ECG can reveal the heart's electrical activity, aiding in the diagnosis of abnormalities.

Transport Mechanisms
E N D
Presentation Transcript
Transport Mechanisms Heart
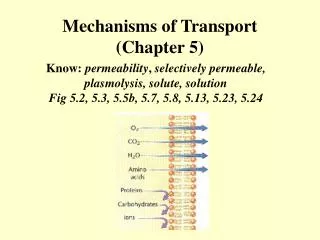
Cardiac Cycle • This is the pattern of contraction and relaxation of the heart during one heartbeat. • Contraction – SYSTOLE • Relaxation – DIASTOLE • Cardiac cycle lasts 0.8 sec • 75 beats per minute
Cardiac Cycle Pattern • Atrial Systole (ventricular diastole) • Ventricular Systole (atrial diastole) • Atrial and Ventricular Diastole 0.0 0.1 0.2 0.3 0.4 0.5 0.6 0.7 0.8 atria ventricles systole diastole
Pressure Changes • AV valves close (end atrial systole) lubb heart sound • SL valves open (ventricular systole) • SL valves close (end ventricular systole) dubb heart sound • AV valves open (atrial and ventricular diastole)
Conducting System • Waves of excitation (electrical impulses) co-ordinate the beating of the heart. • 4 parts to it - sino-atrial node (SAN) - atrio-ventricular node (AVN) - Bundle of His - Purkinje Fibres
Conducting System • SAN – sino-atrial node is the pacemaker. It exhibits spontaneous excitation and sends out electrical impulses that make the heart muscle in the atria contract at a certain rate. • AVN – atrio-ventricular node picks up electrical impulses from the SAN and passes them onto the Bundle of His found between the two ventricles.
Conducting Systen • Purkinje Fibres branch from the Bundle of His. They branch round the two ventricles and cause simultaneous contraction of the ventricles.
Electrocardiogram An ECG shows the electrical activity of the heart.
One Heartbeat • P wave – excitation across atria from SAN. • QRS – wave of excitation passing through the ventricles. • T – recovery of the ventricles at the end of ventricular systole.
Abnormal ECG Atrial fibrilation Ventricular Fibrilation Ventricular Tachycardia
Blood Pressure • Blood pressure is measured in millimetres of mercury (mmHg). • During ventricular systole blood pressure in the aorta rises to 120 mmHg. • During ventricular diastole it falls to 80 mmHg. • Average blood pressure 120/80 mmHg (systolic/diastolic) • Blood Pressure is measured using a sphygmomanometer.
Decreasing Blood Pressure • As blood travels round the circulatory system the pressure drops